

Create Dashboard
Describe a dashboard
Section titled “Describe a dashboard”Under Dashboards, choose Describe a dashboard and say what you want to see, for example “p95 latency and error count per service, and the slowest operations”. The AI analyst drafts up to eight widgets, each with its title, chart type and ClickHouse query over your traces and logs. Every query is checked like any widget query: one read-only SELECT, no system tables, settings or table functions. Review the widgets and their queries, then choose Create dashboard. Nothing is created until you do, and you can edit any widget afterwards.
The draft counts toward the analyst’s budget and hourly limit. The model is sent your description, with names pseudonymised, and the table columns. It sees no telemetry. Drafting needs Create dashboards.
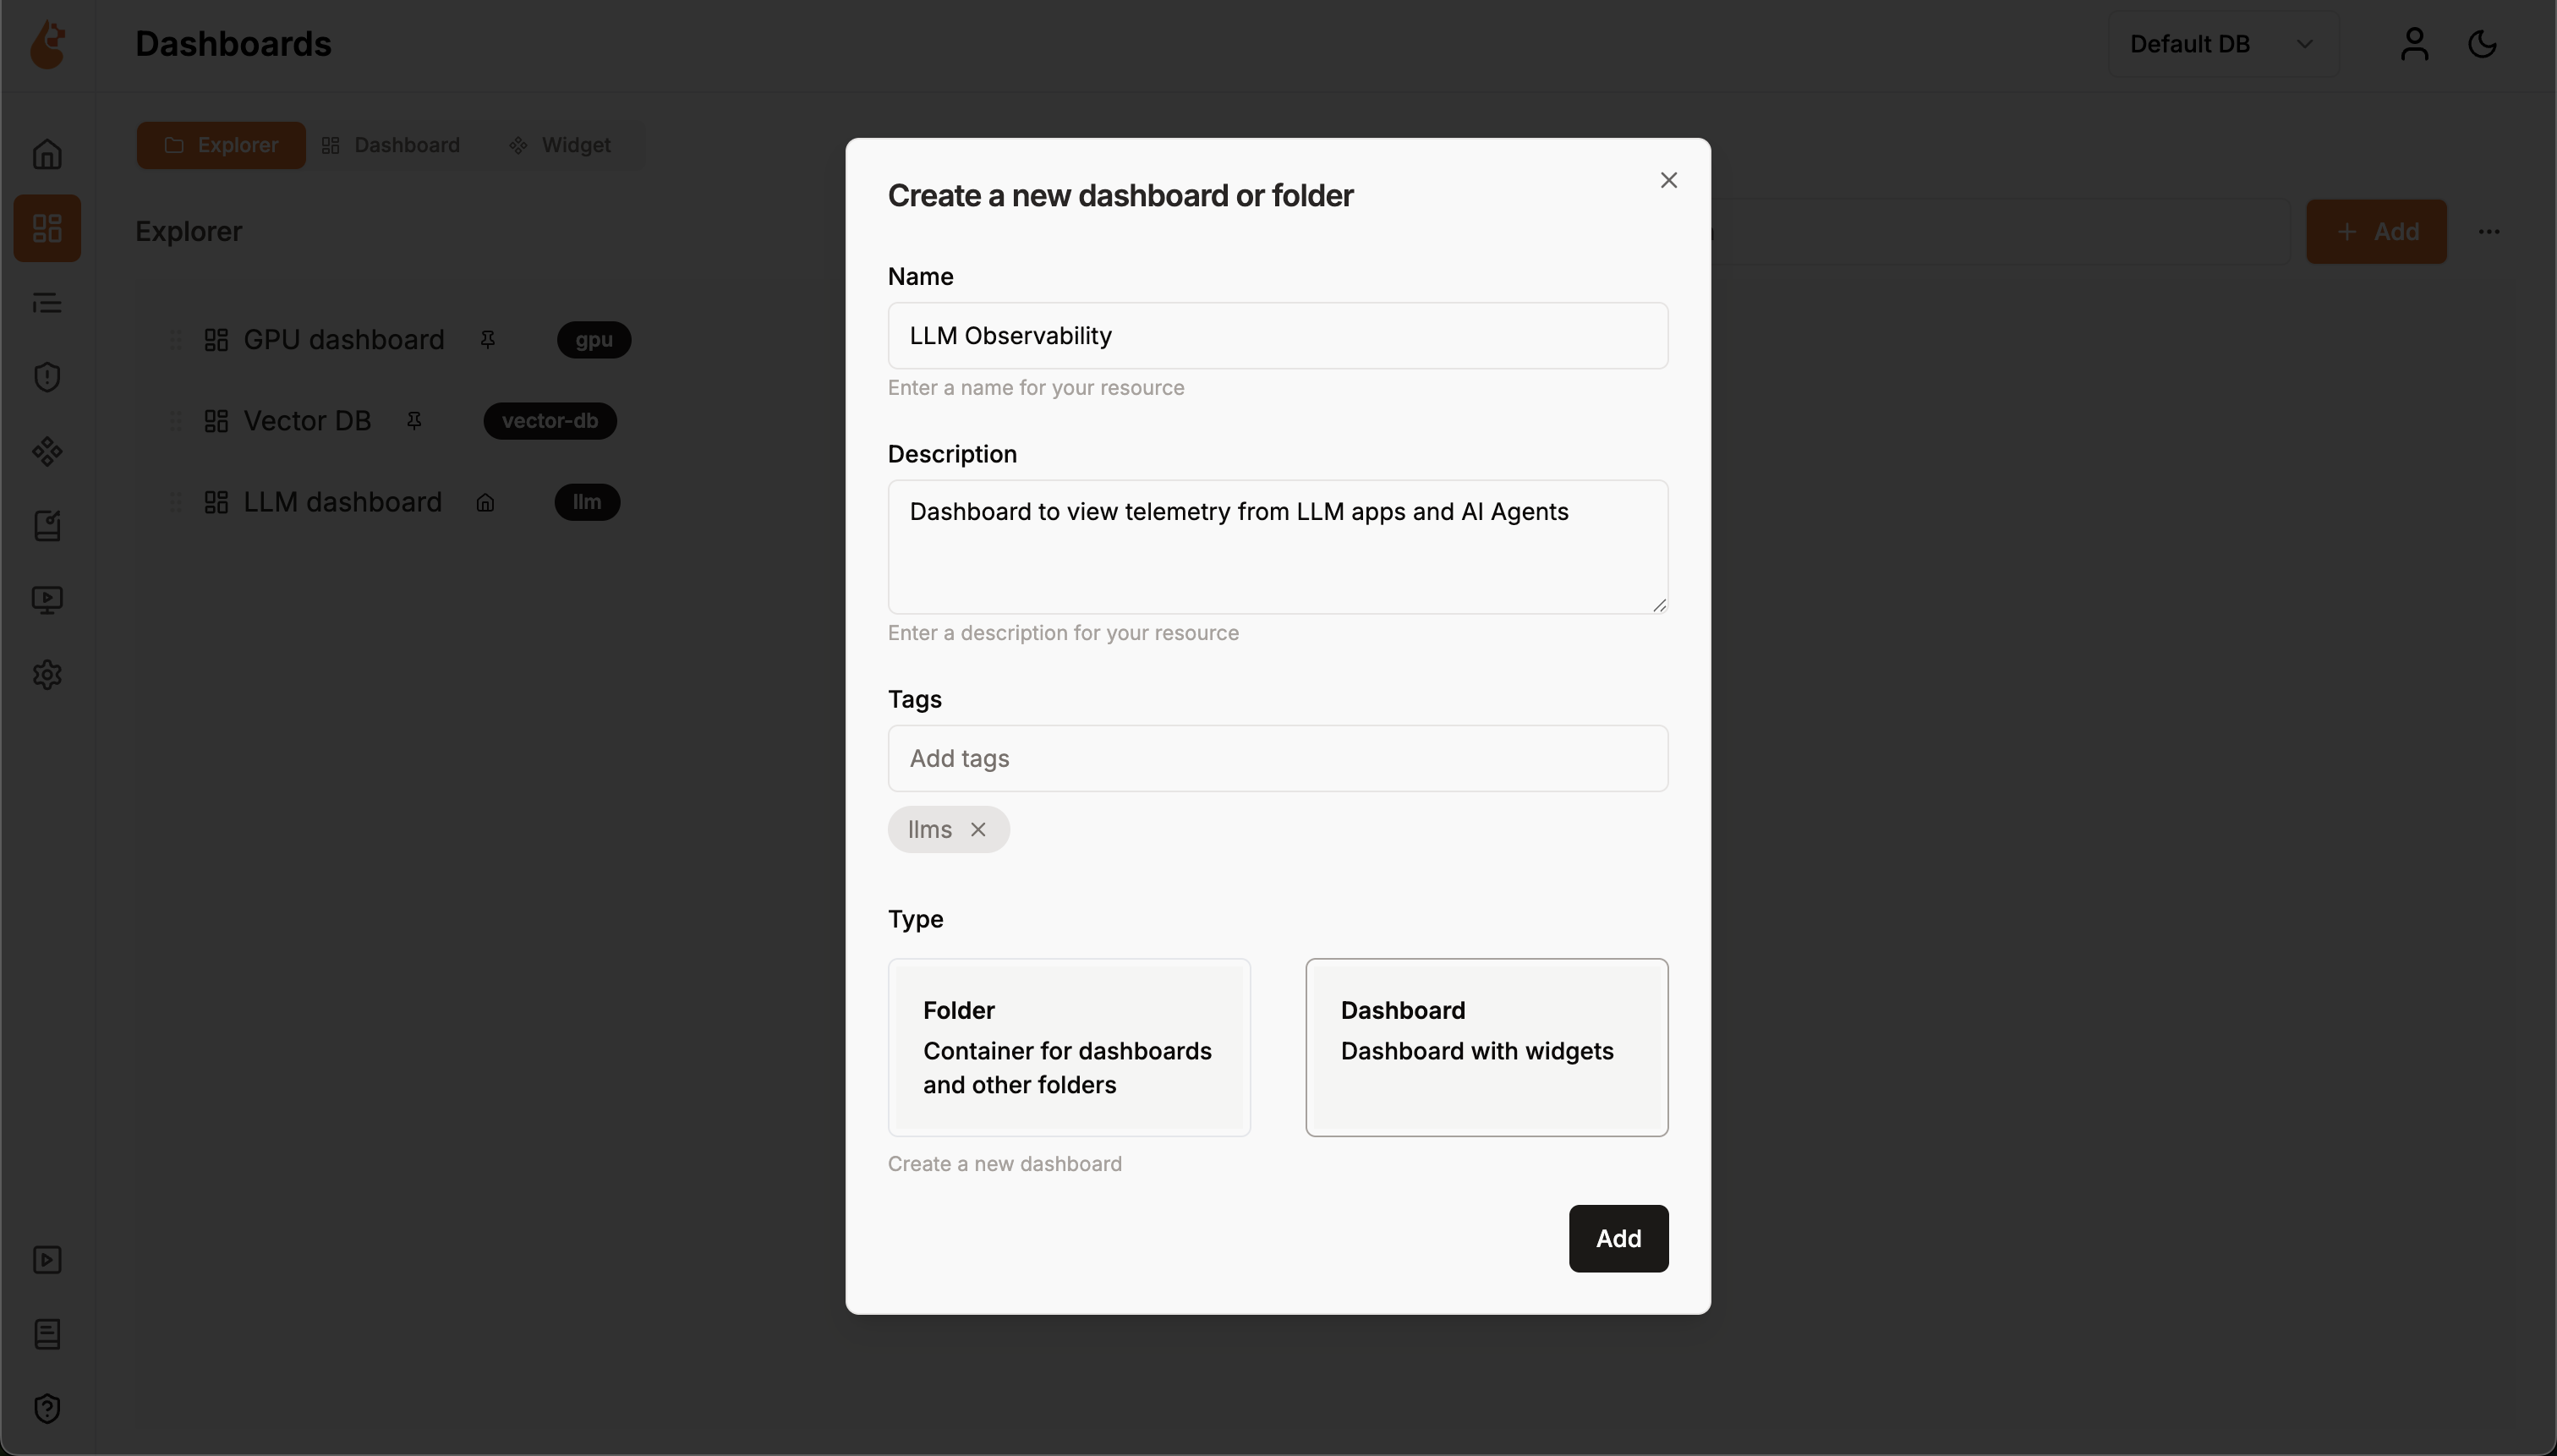
- Navigate to the Dashboards section in the main navigation
- Click the Create new dashboard button in the top right corner
- A “Create a new dashboard or folder” popup will appear
- Fill in the dashboard details:
- Name: Enter a descriptive name (e.g., “LLM Observability”)
- Description: Describe the dashboard’s purpose (e.g., “Dashboard to view telemetry from LLM apps and AI Agents”)
- Tags: Add relevant tags for organization and searchability
- Type: Select Dashboard (Dashboard with widgets)
- Click the Add button to create your dashboard
- You’ll be taken to the empty dashboard canvas ready for widgets
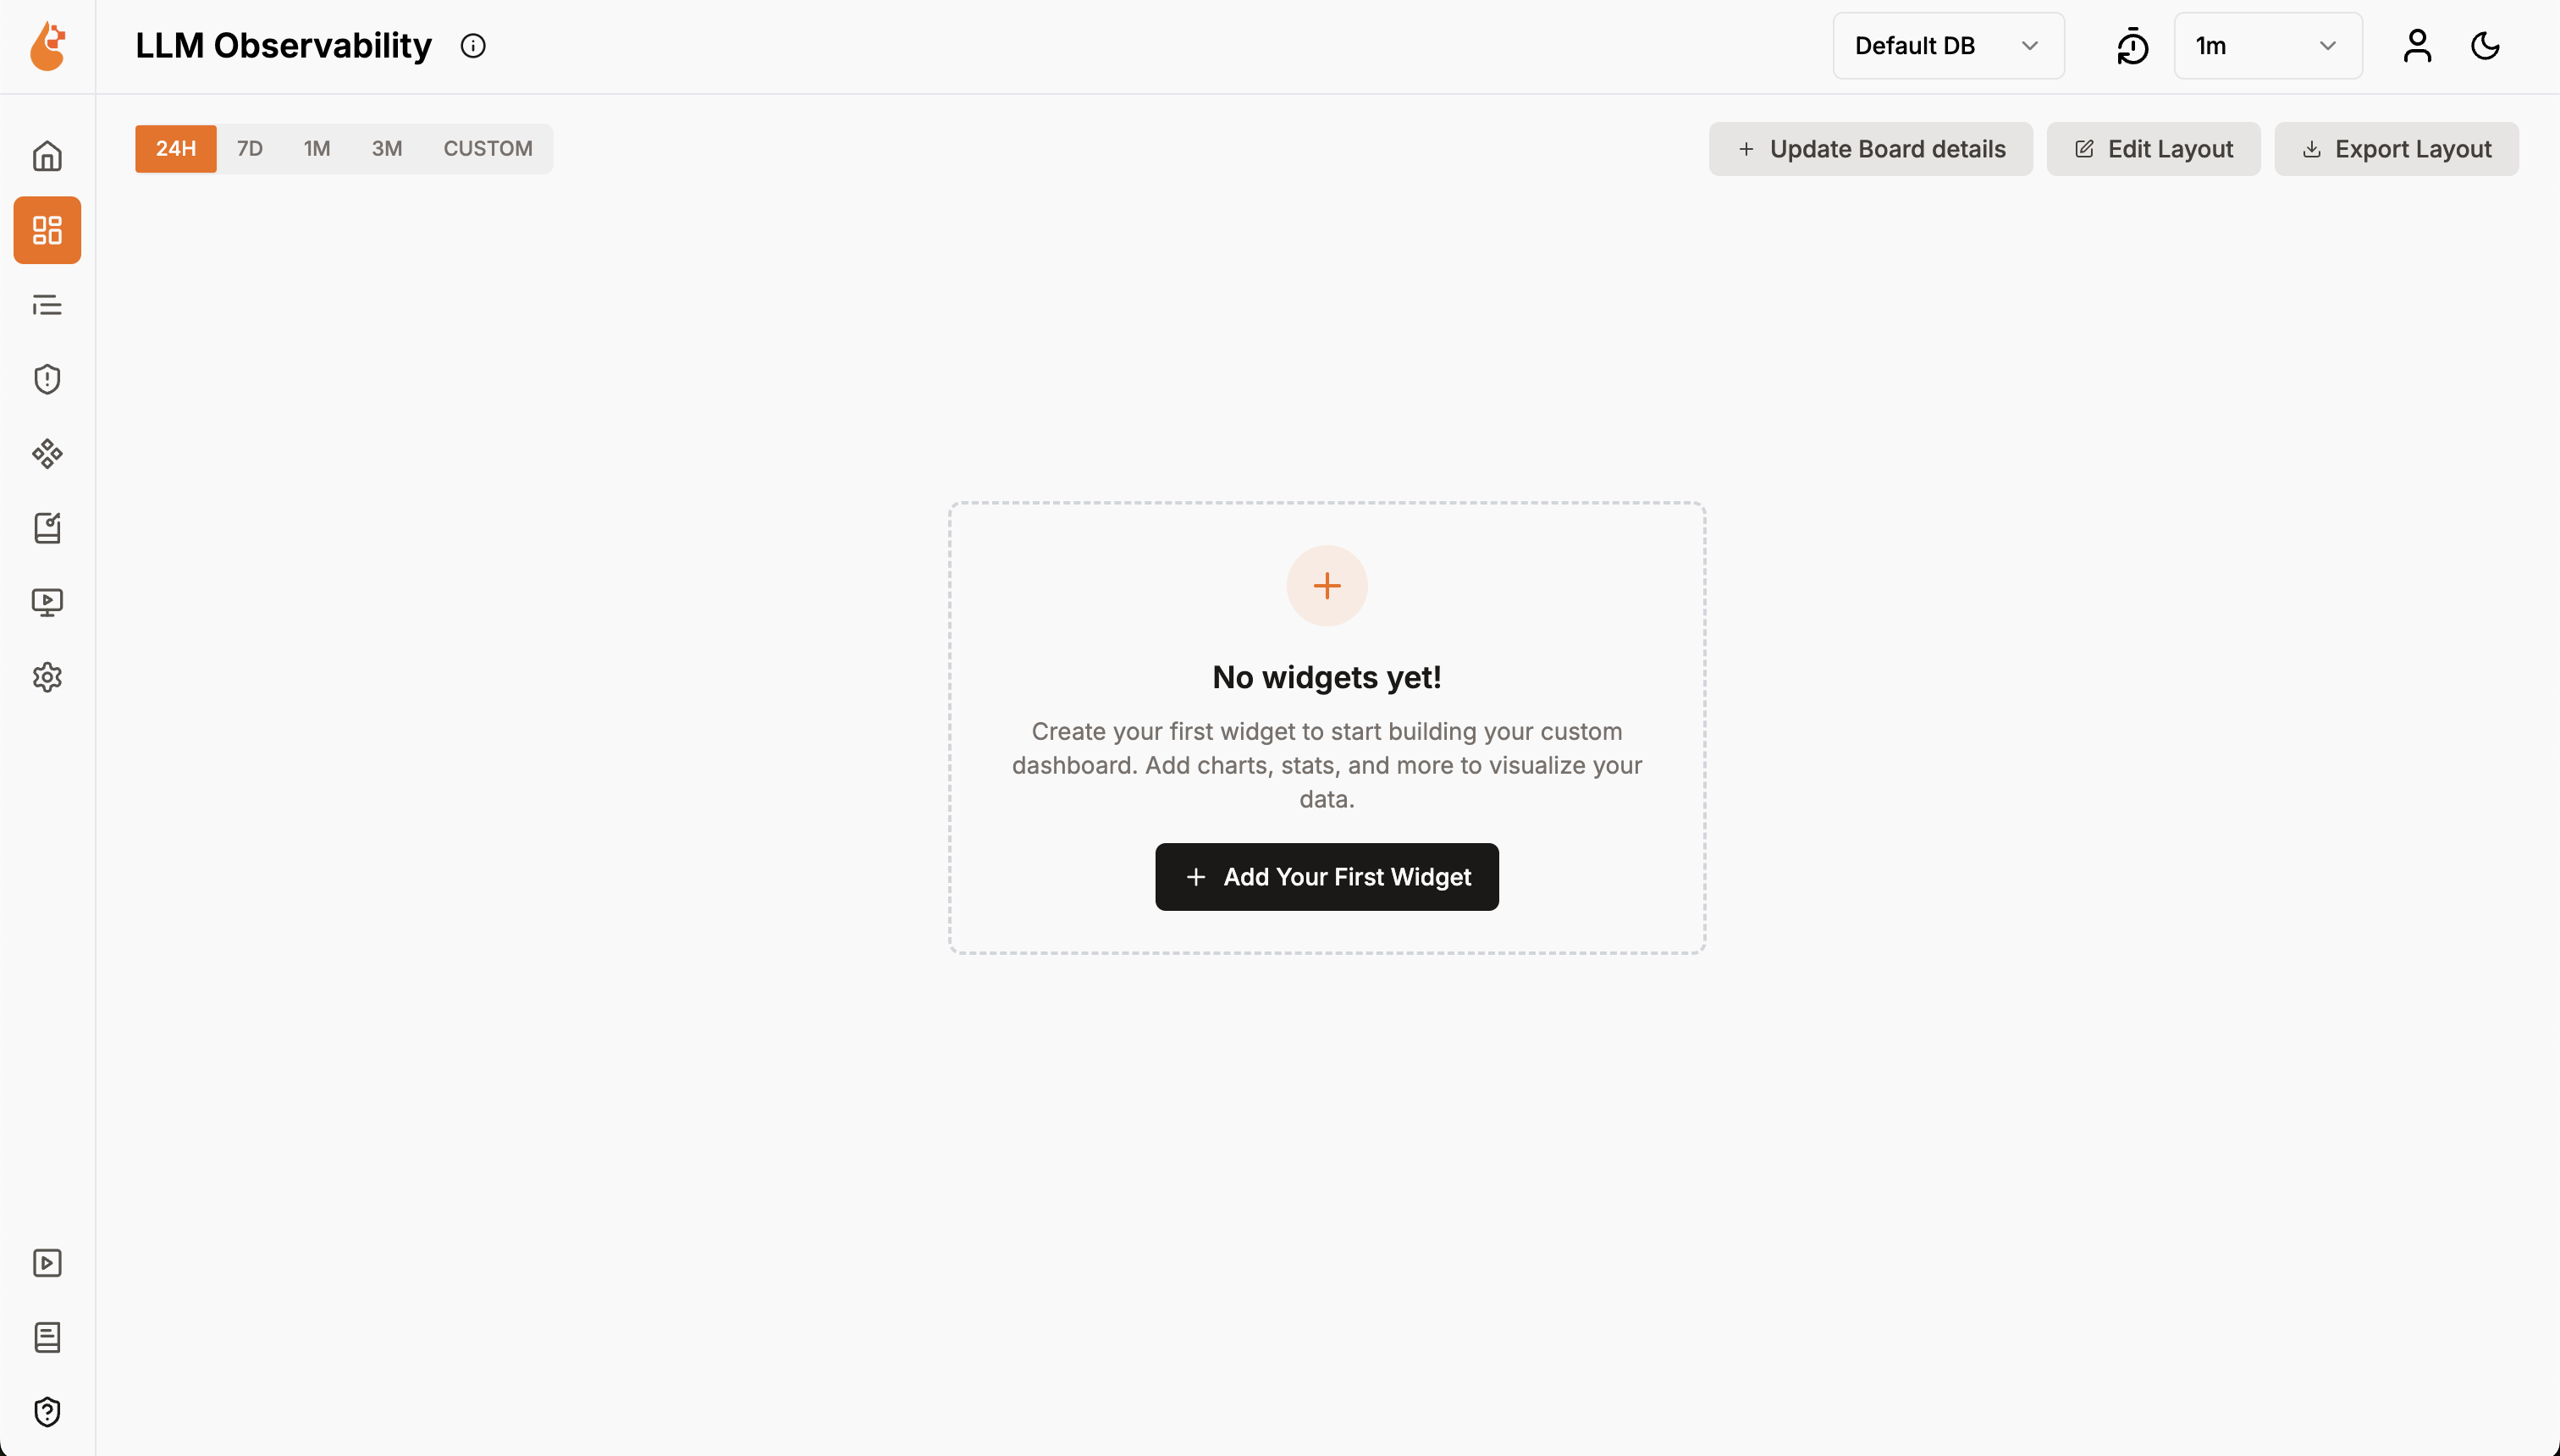
- Click Create Your First Widget button on the empty dashboard
- You’ll see a “Select a Widget” popup with two options:
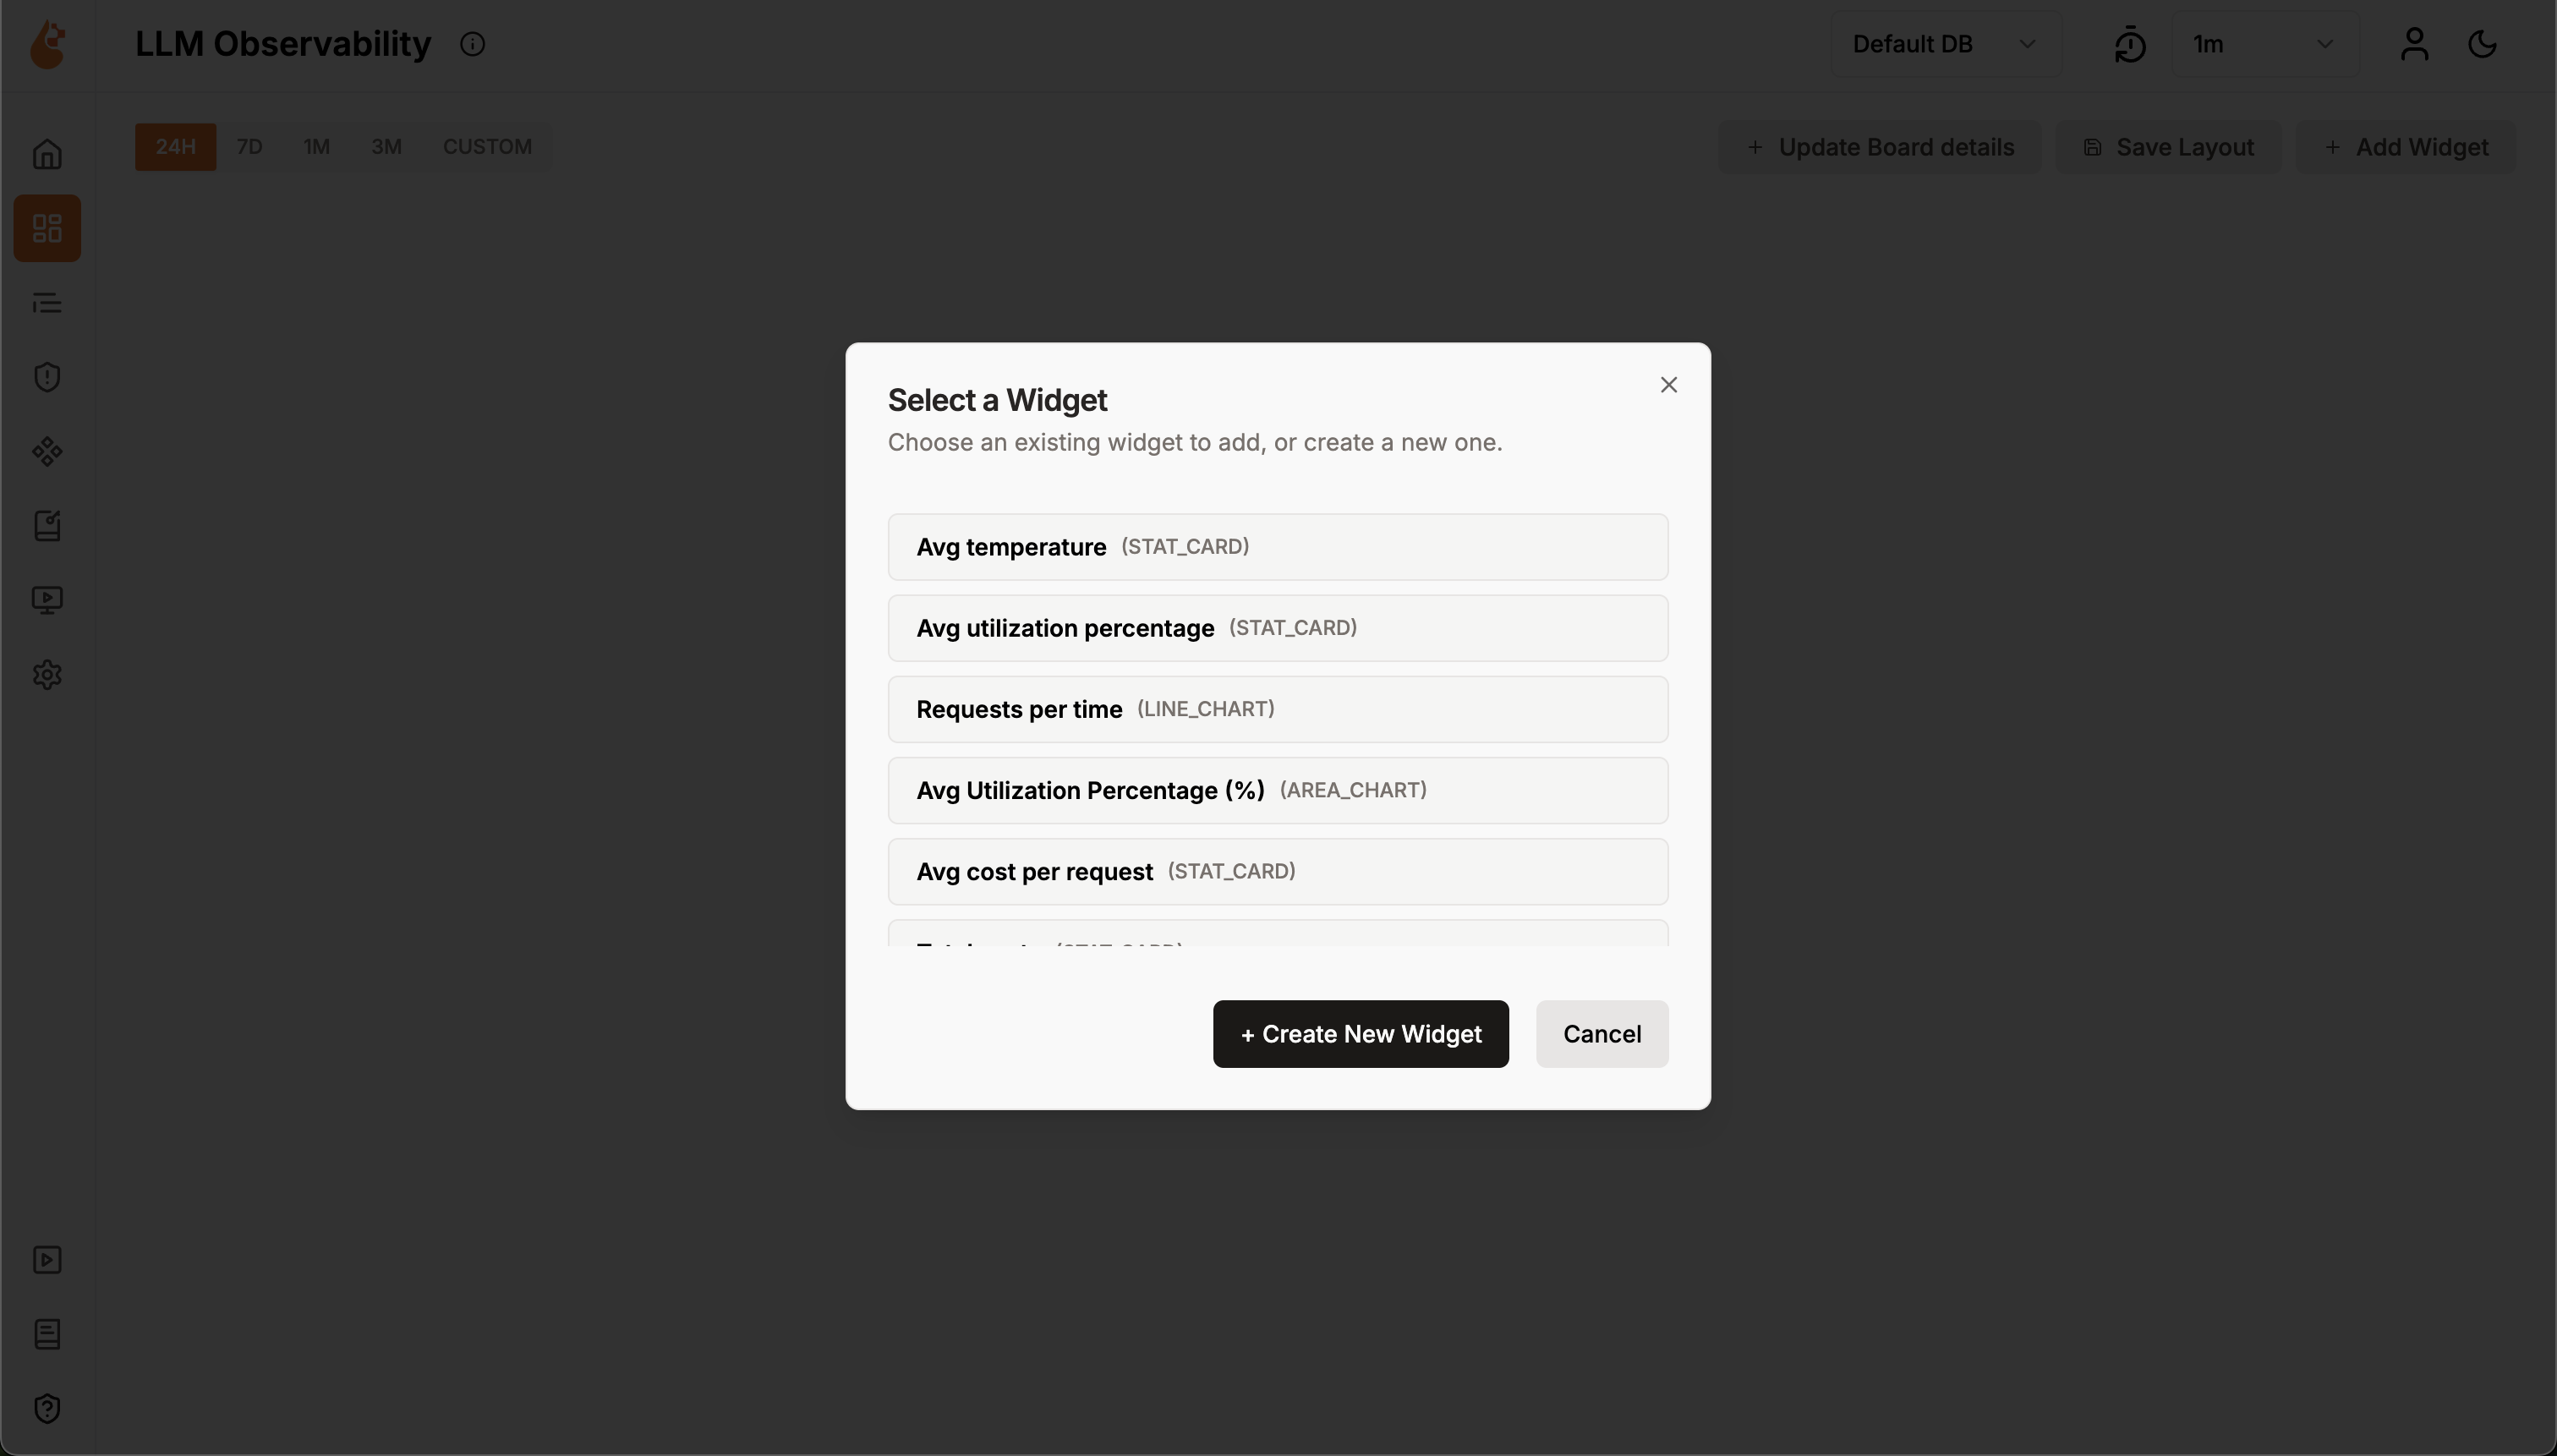
- Choose from existing widgets: Select from pre-built widgets like “Avg temperature”, “Avg utilization percentage”, “Requests per time”, etc.
- Create new widget: Click + Create New Widget to build a custom widget
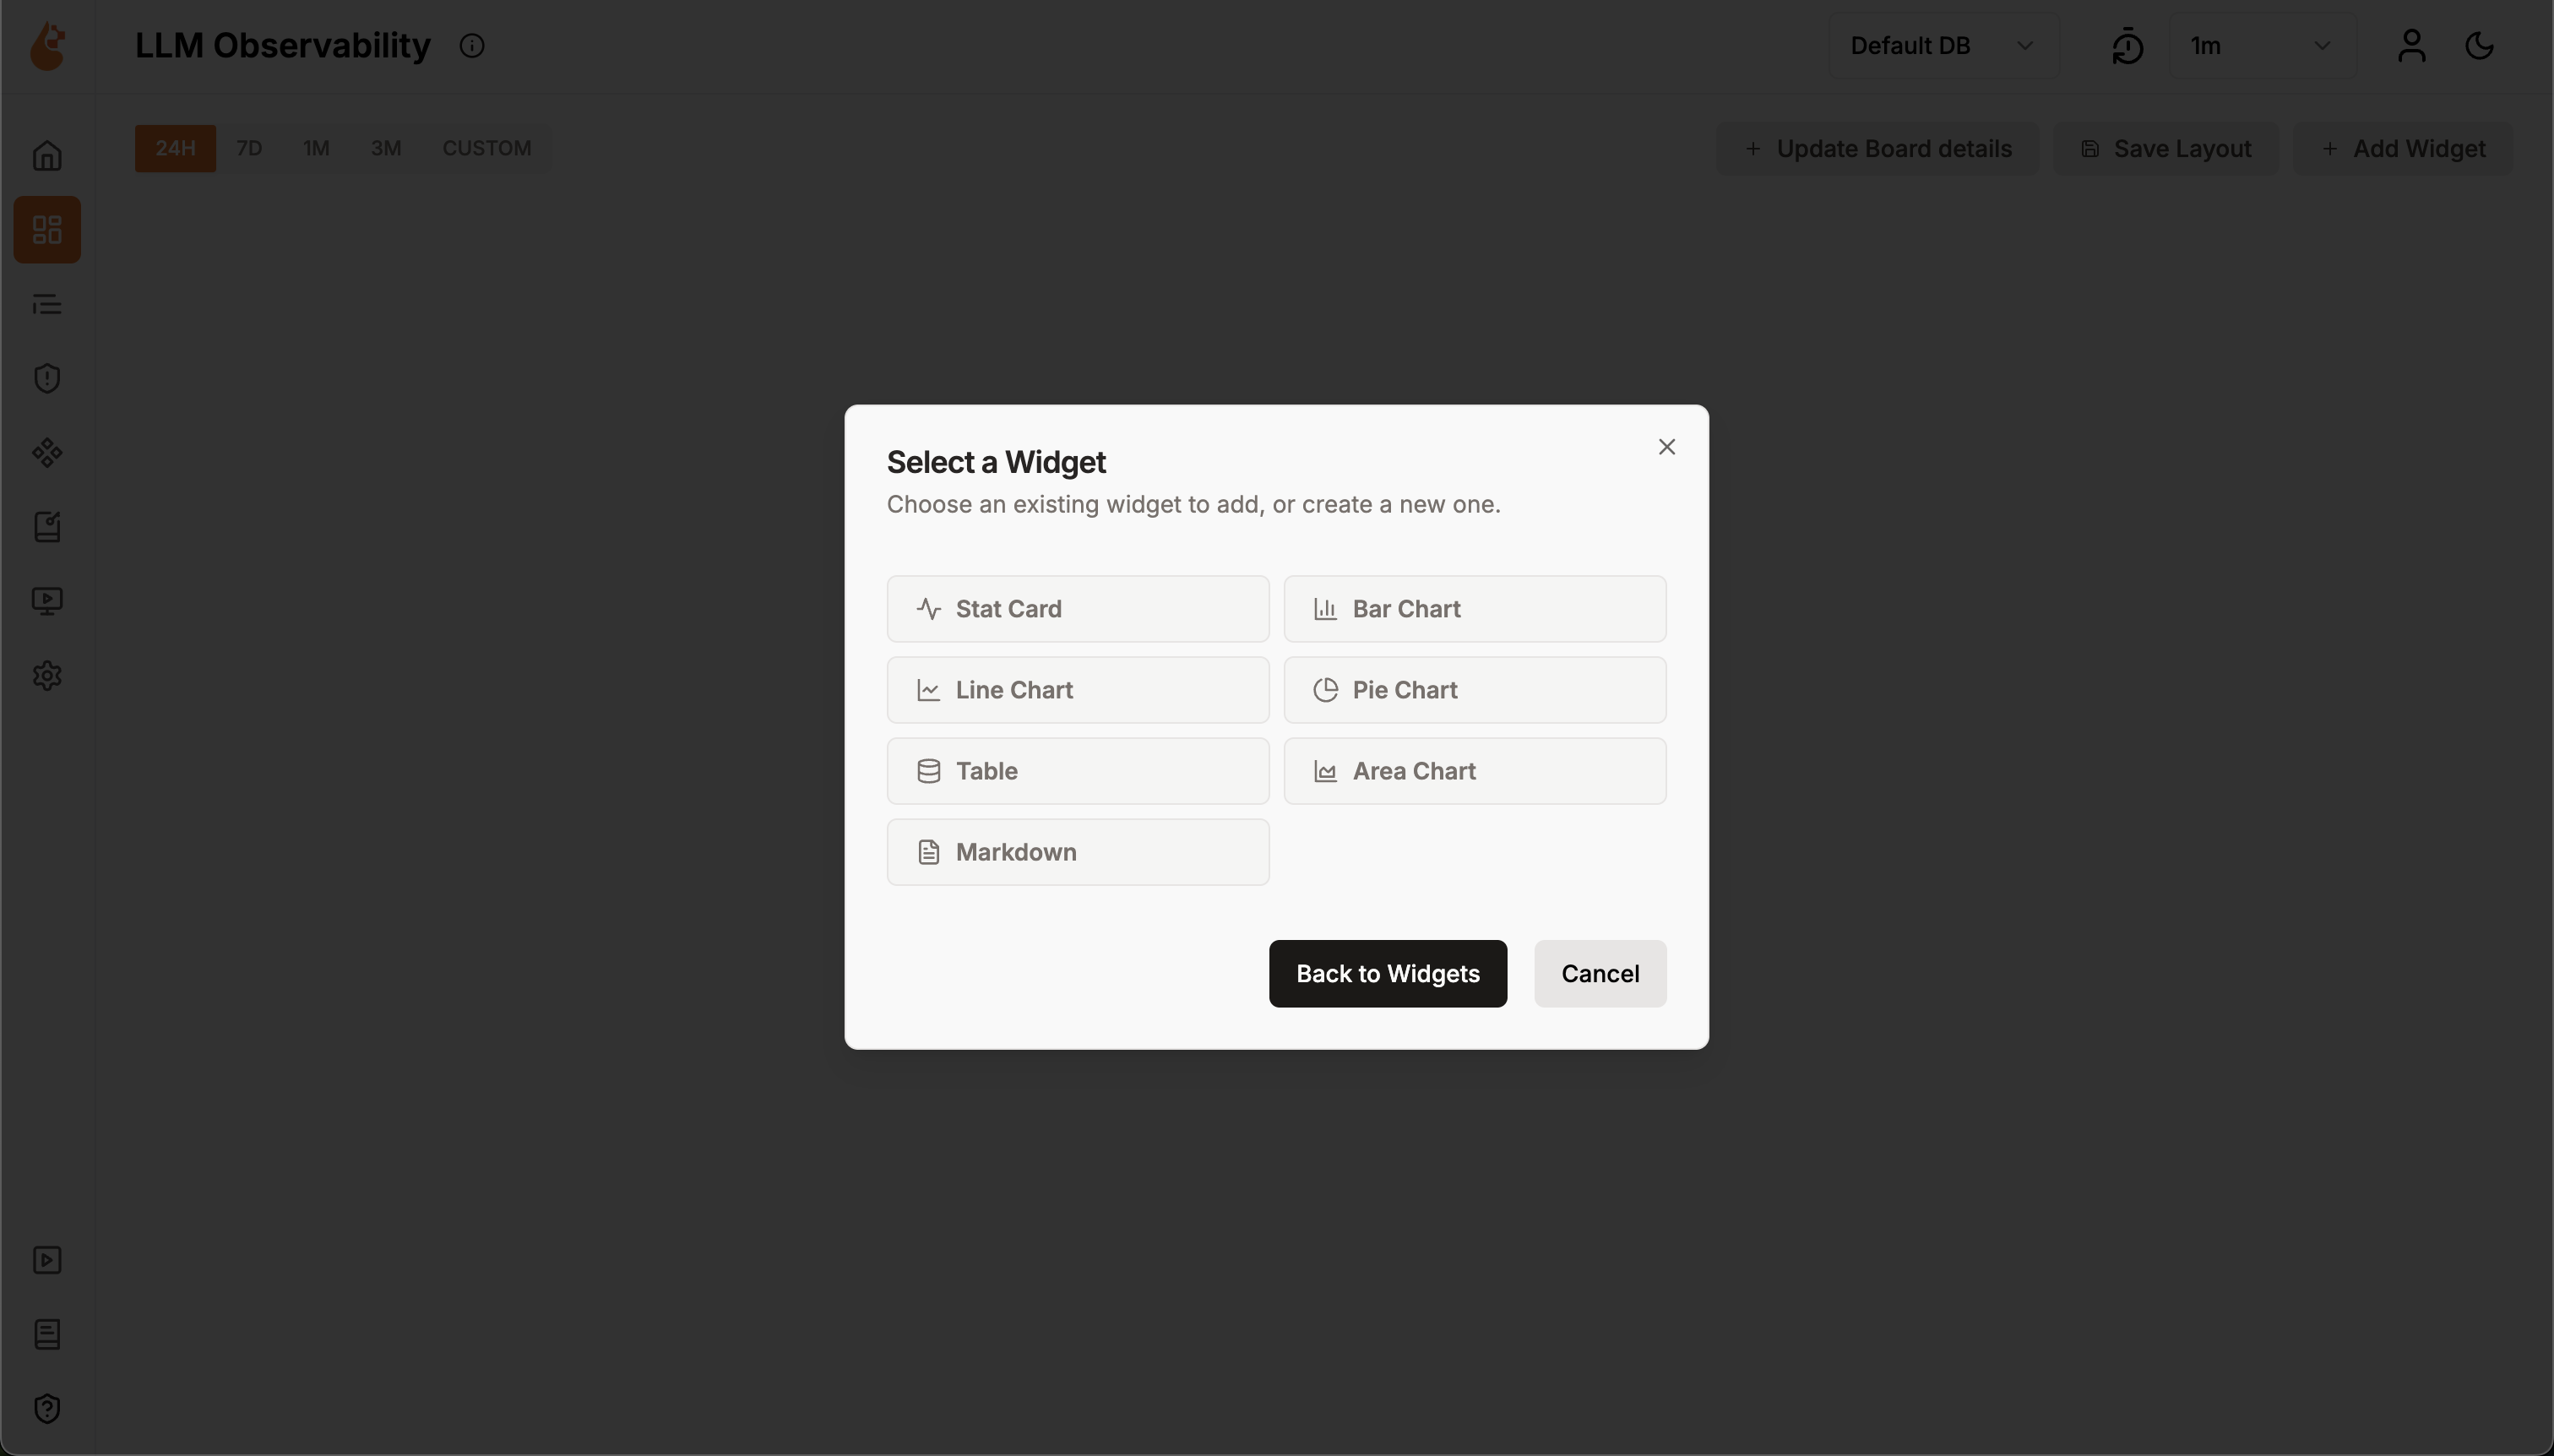
When creating a new widget, you’ll see a configuration panel with three tabs: General Tab
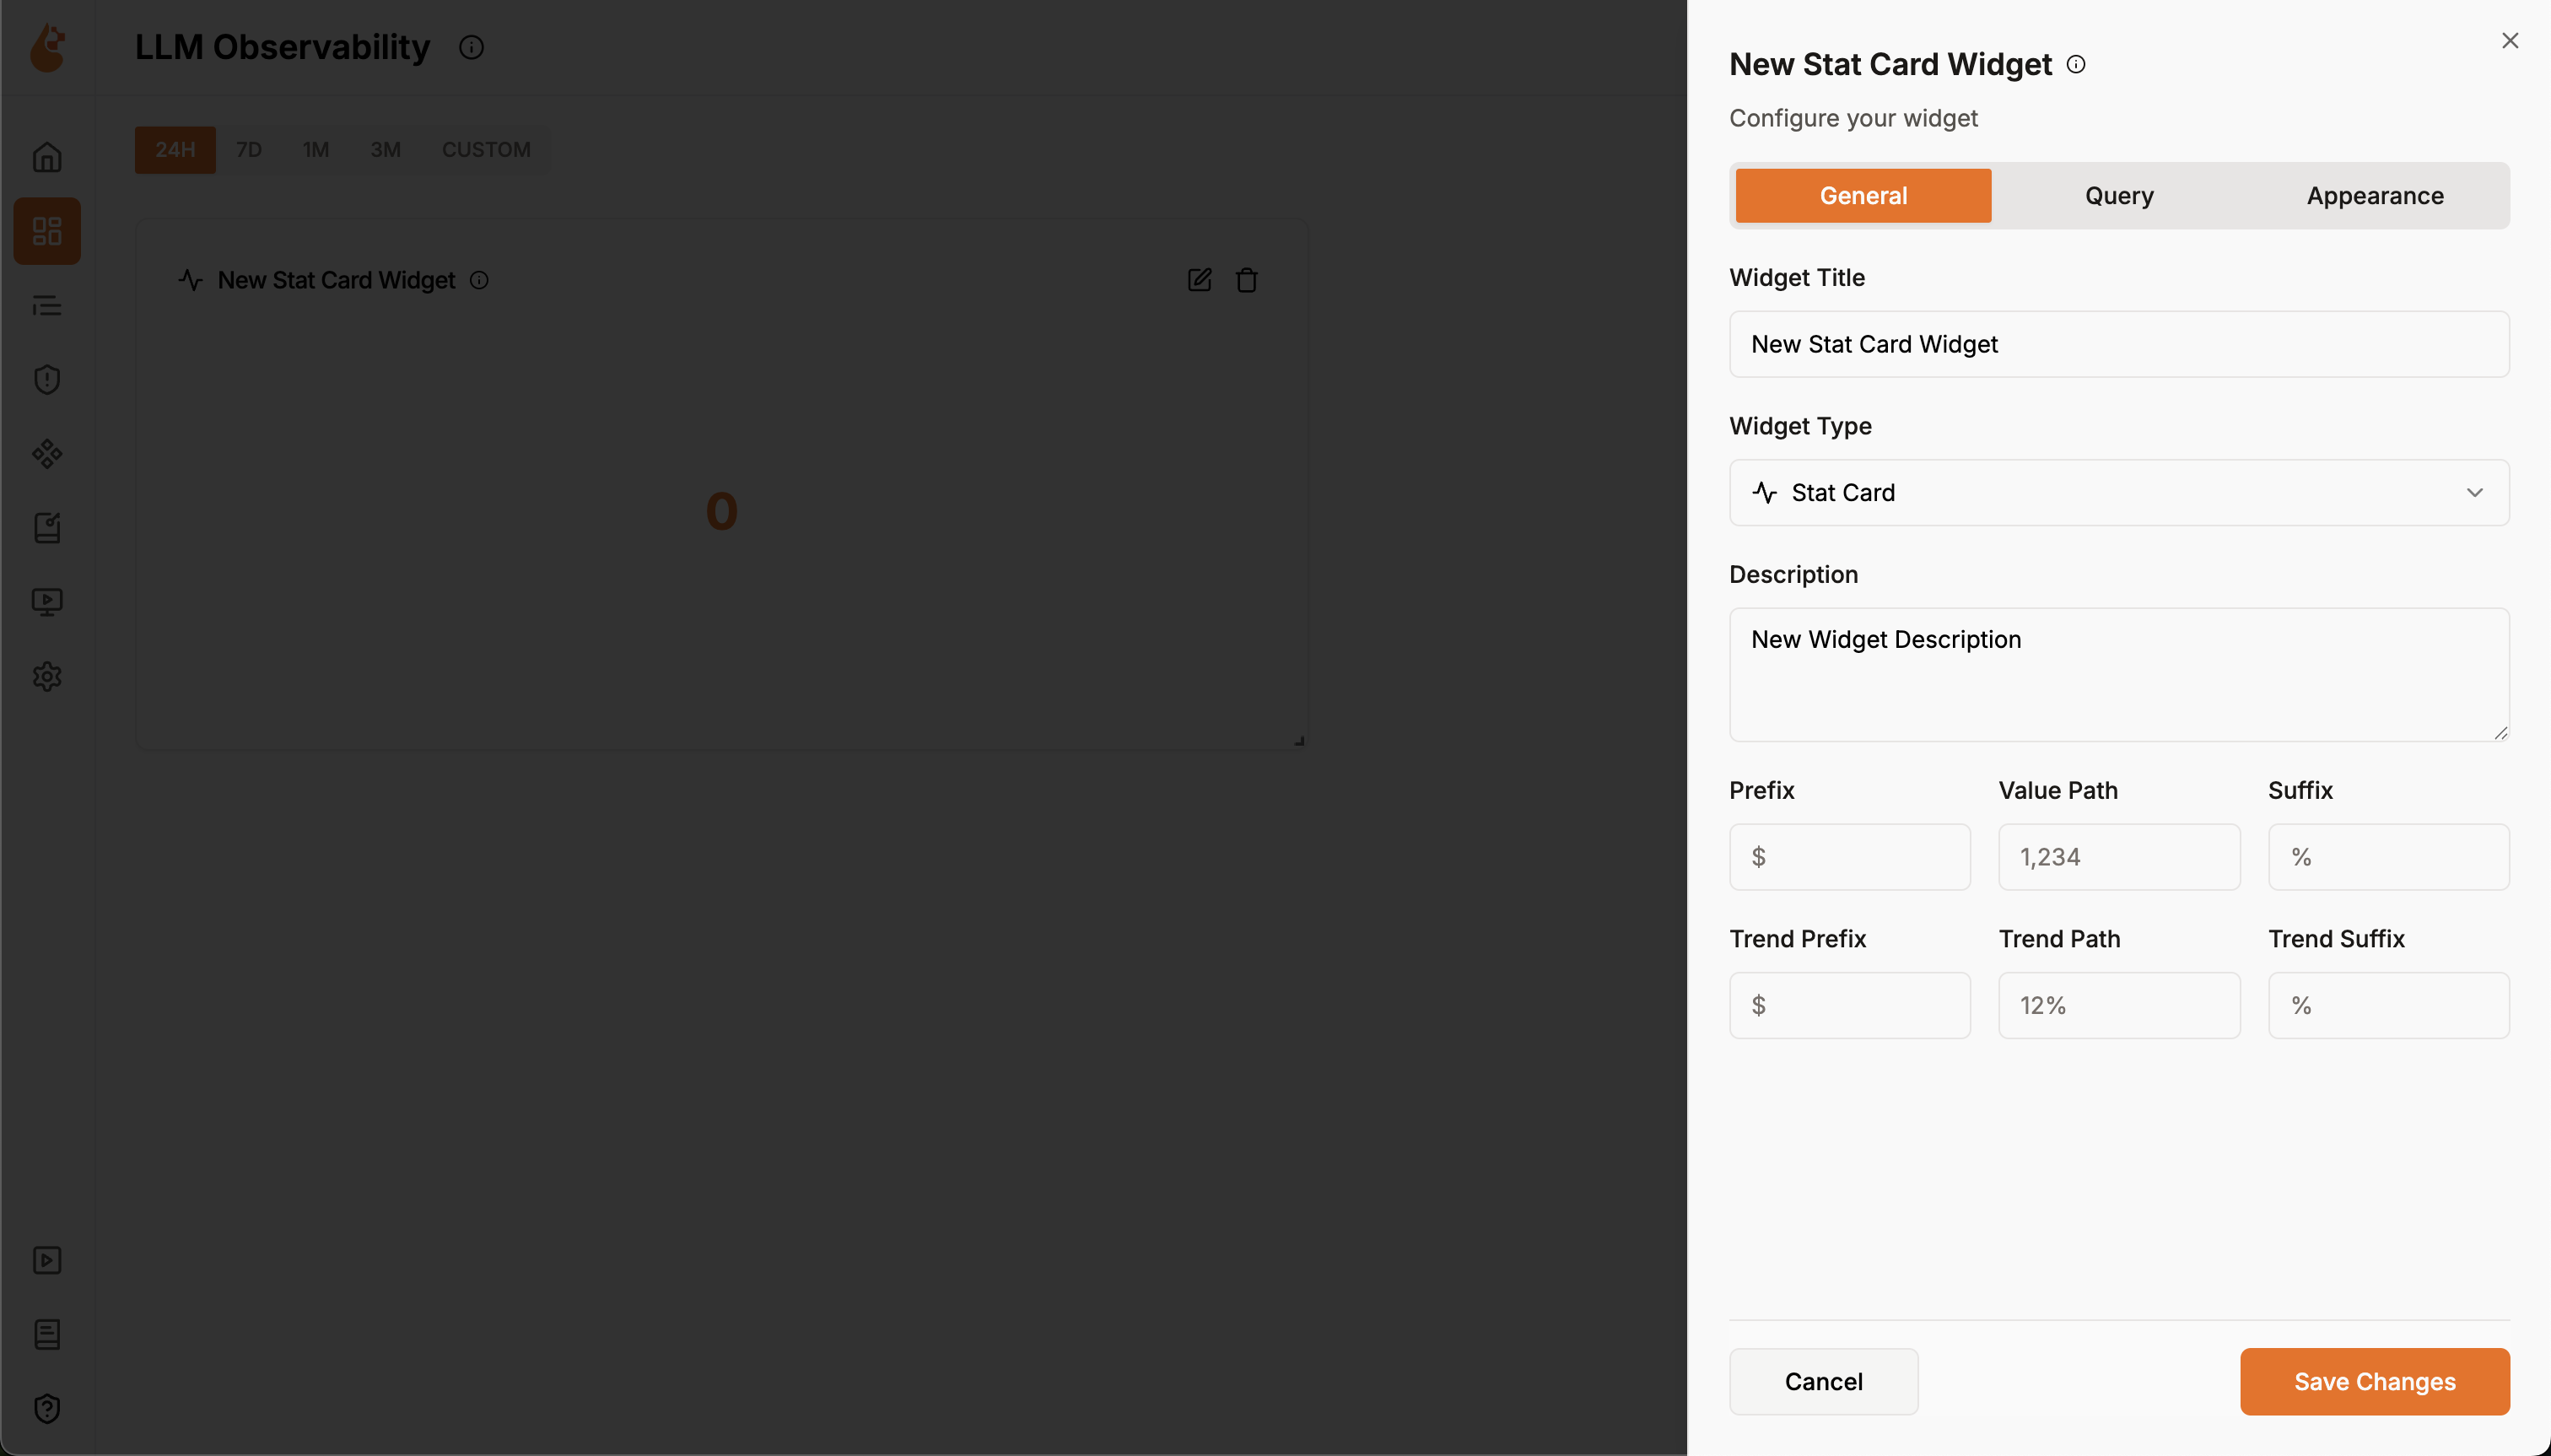
- Widget Title: Enter a descriptive name (e.g., “Total Requests”)
- Widget Type: Select from Stat Card in this example
- Description: Add context about what the widget shows
- Value Path: Specify which field from your query to display (e.g.,
0.count()in this example) - Prefix: Add symbols before the value (e.g.,
$for costs) - Suffix: Add units after the value (e.g.,
%for percentages)
Query Tab
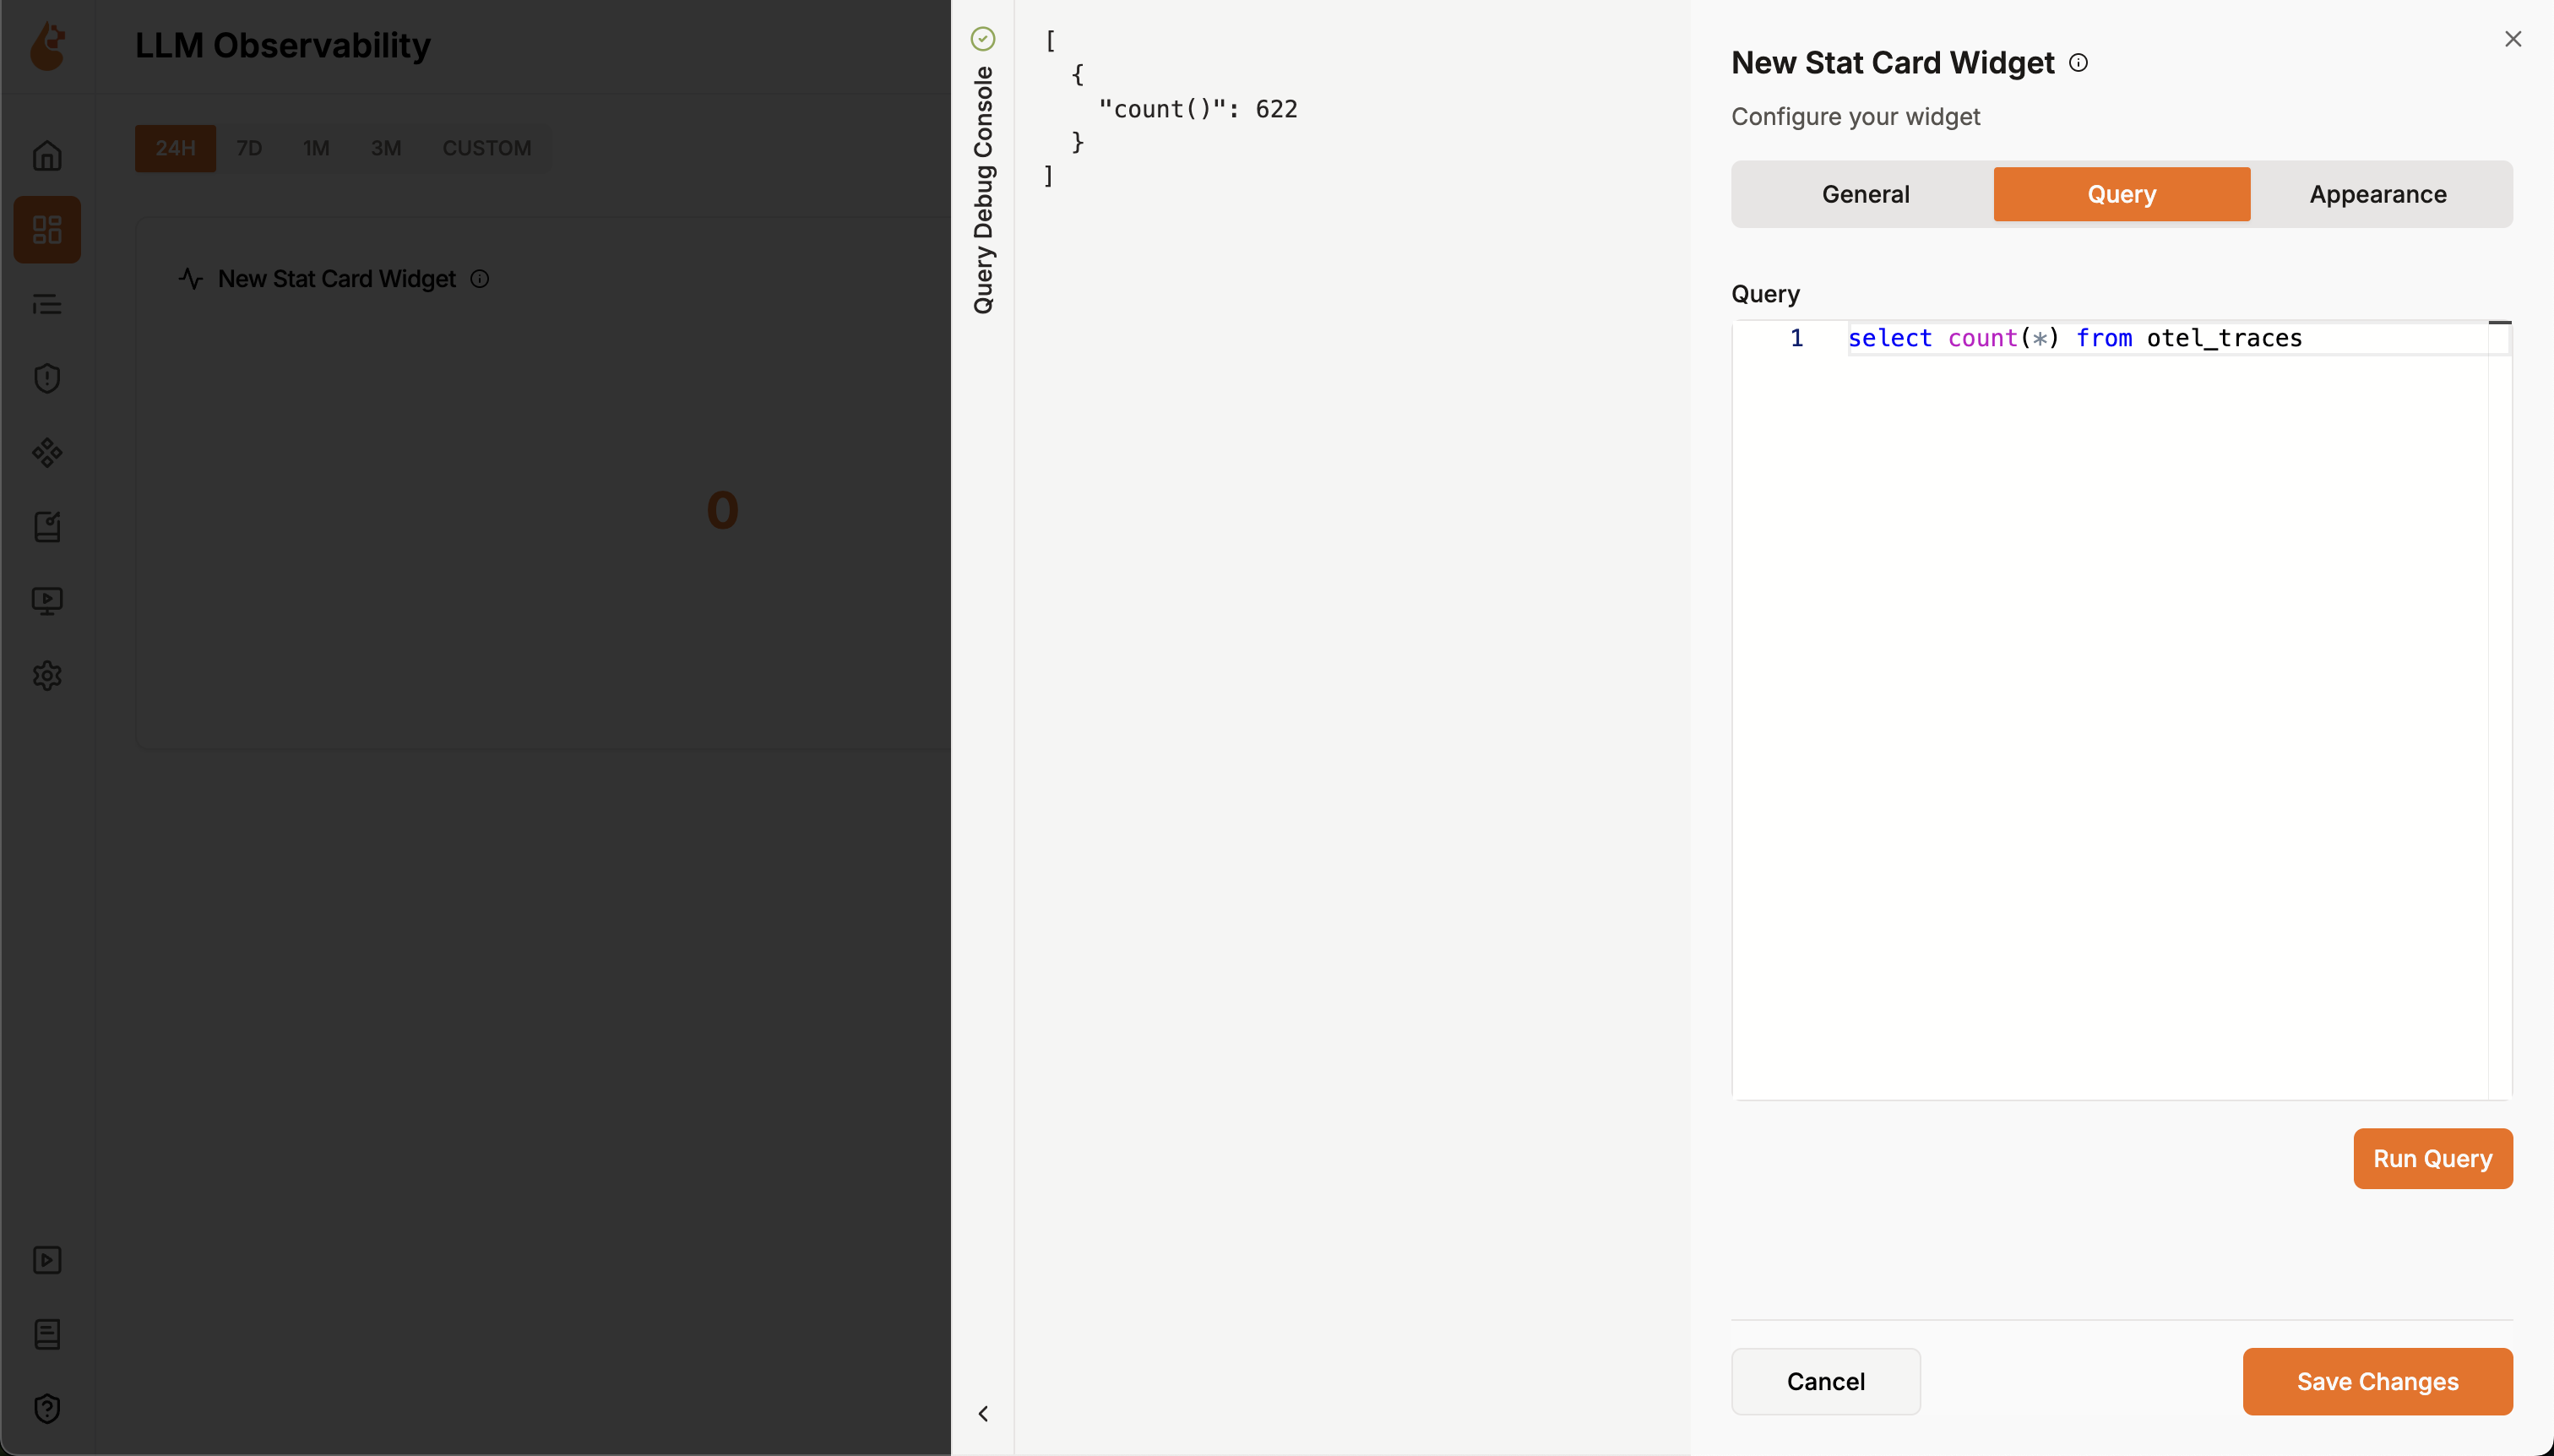
- Write your SQL query against the ClickHouse database. For example:
SELECT count(*) FROM otel_traces
- Test your query by clicking Run Query
- Verify the results - you’ll see output like:
{"count()": 622}
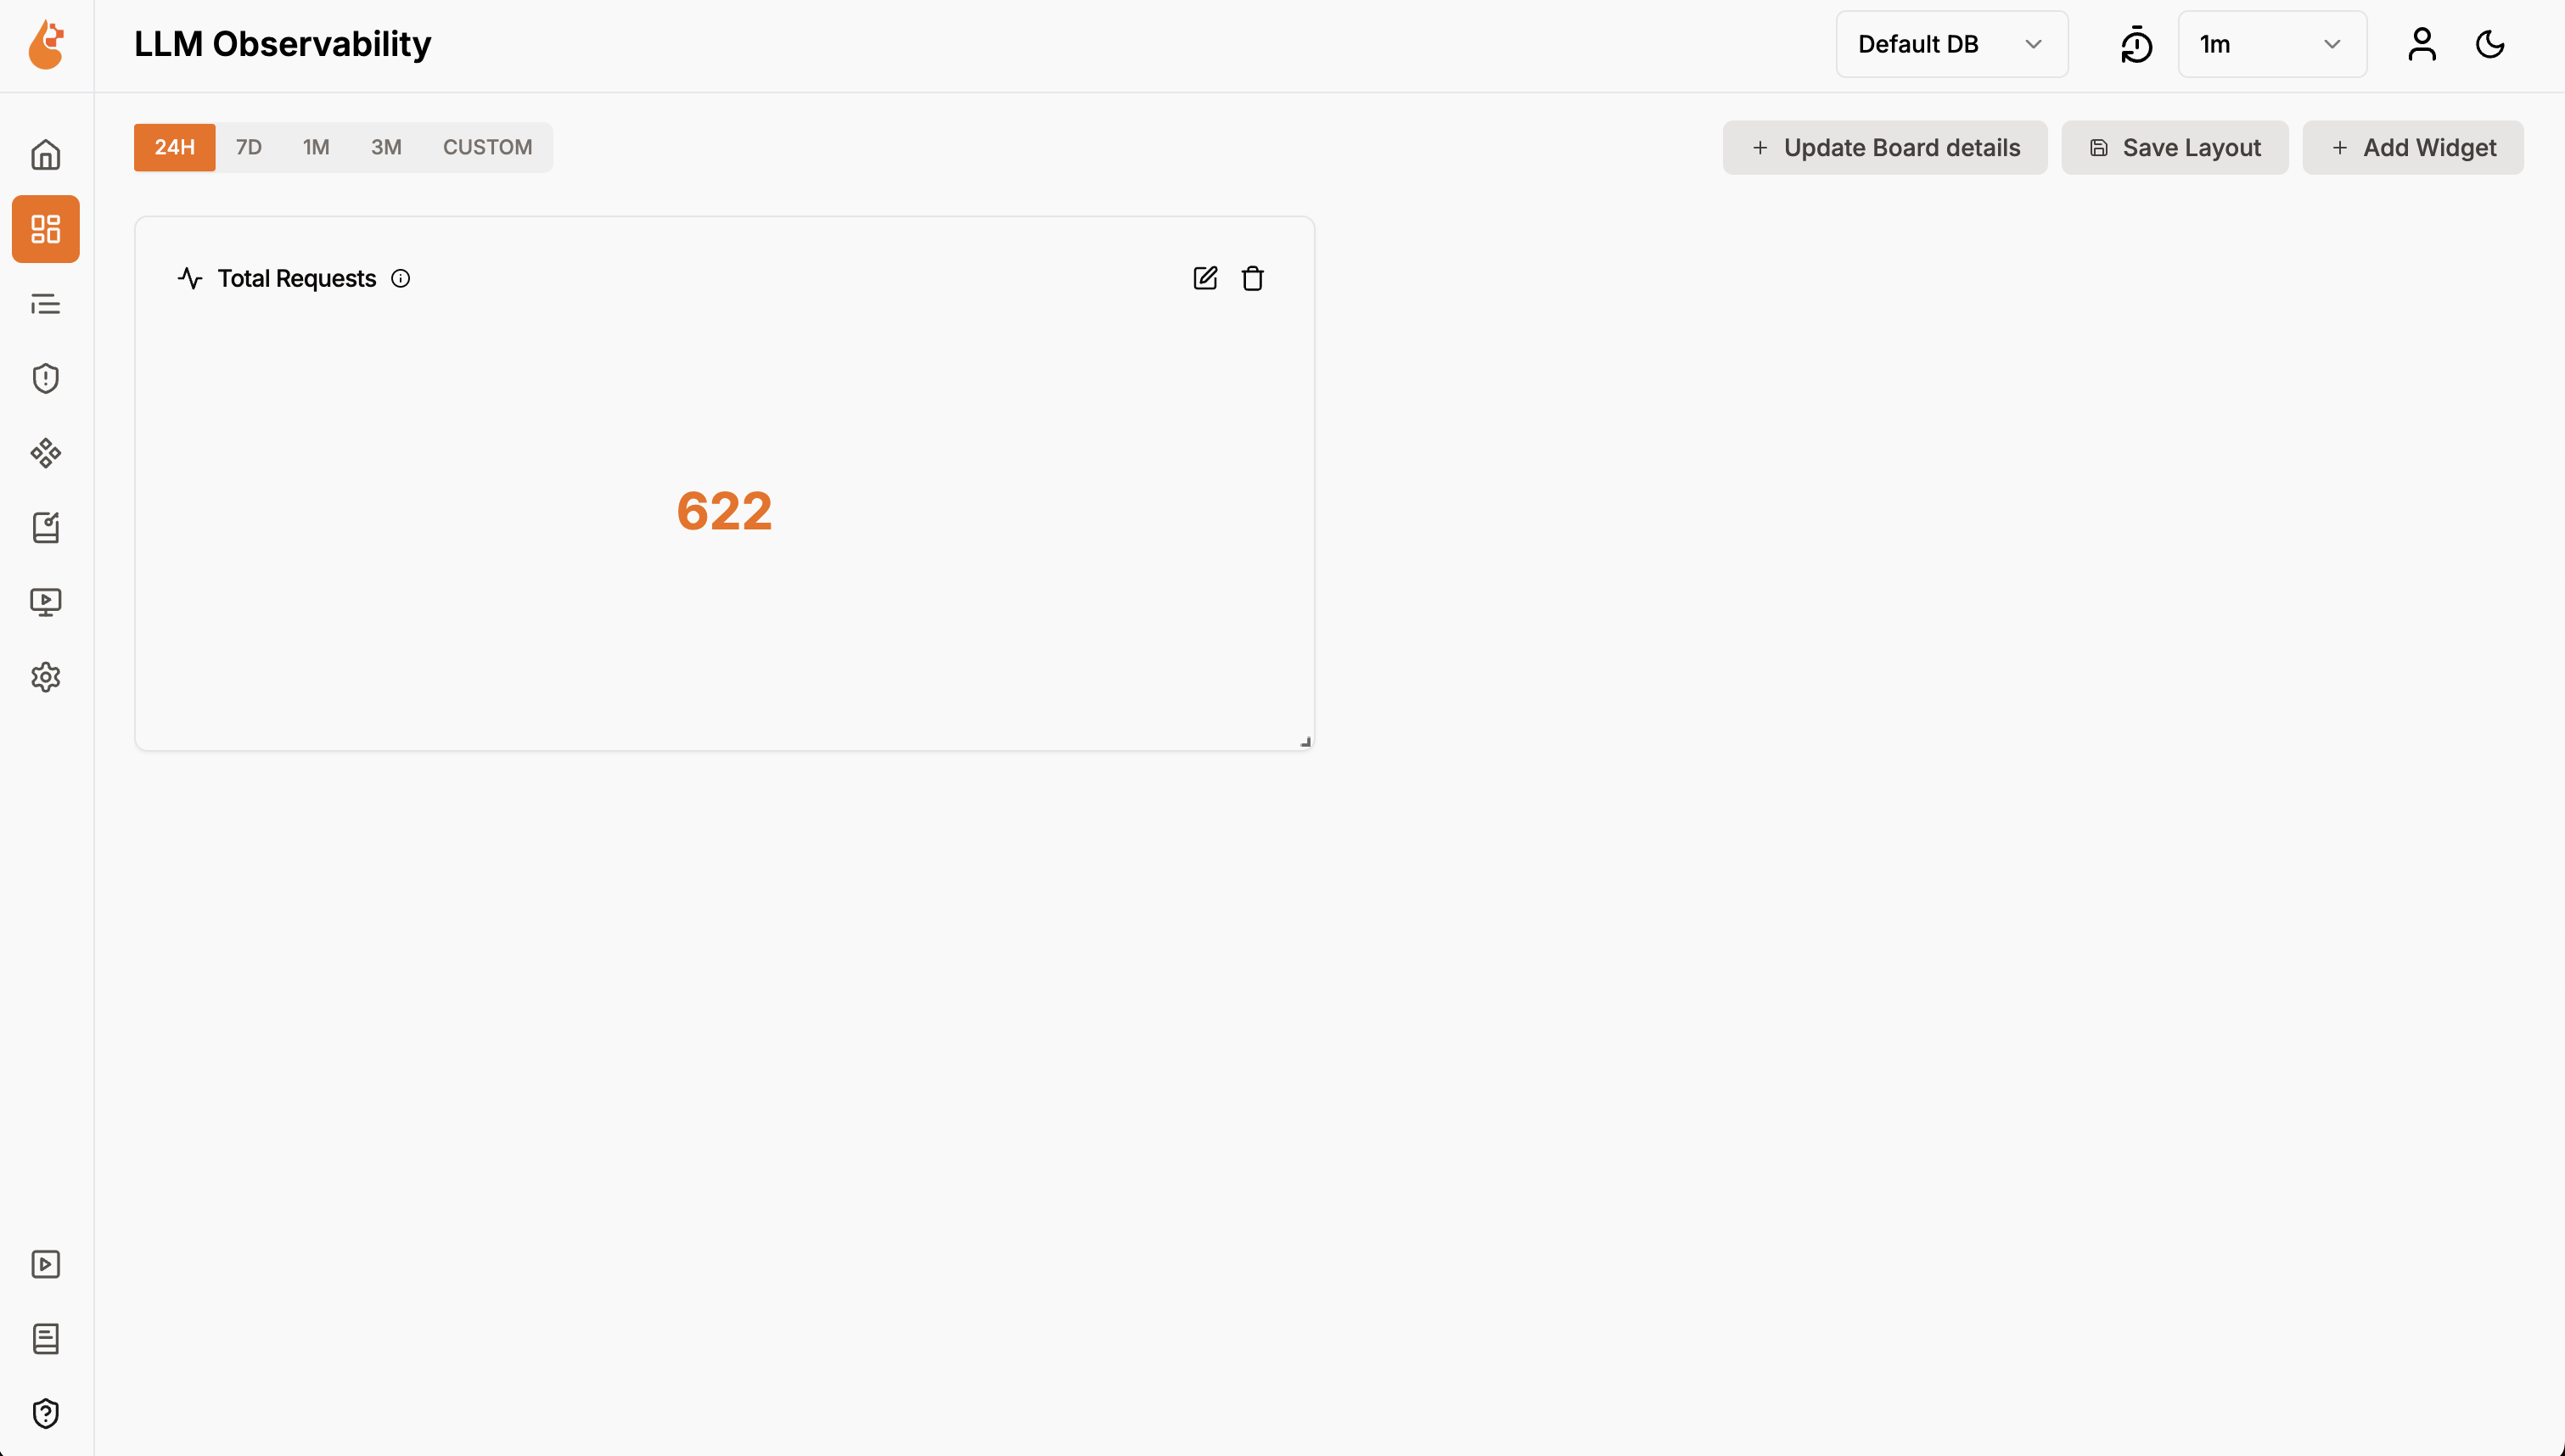
- Click Save Changes to add the widget to your dashboard
- The widget will appear on your dashboard canvas
- You can immediately see your data visualization
- Add more widgets: Click Create Widget to add additional visualizations
- Resize widgets: Drag the corners of any widget to adjust its size
- Move widgets: Drag widgets to rearrange their positions on the dashboard