

DataDog
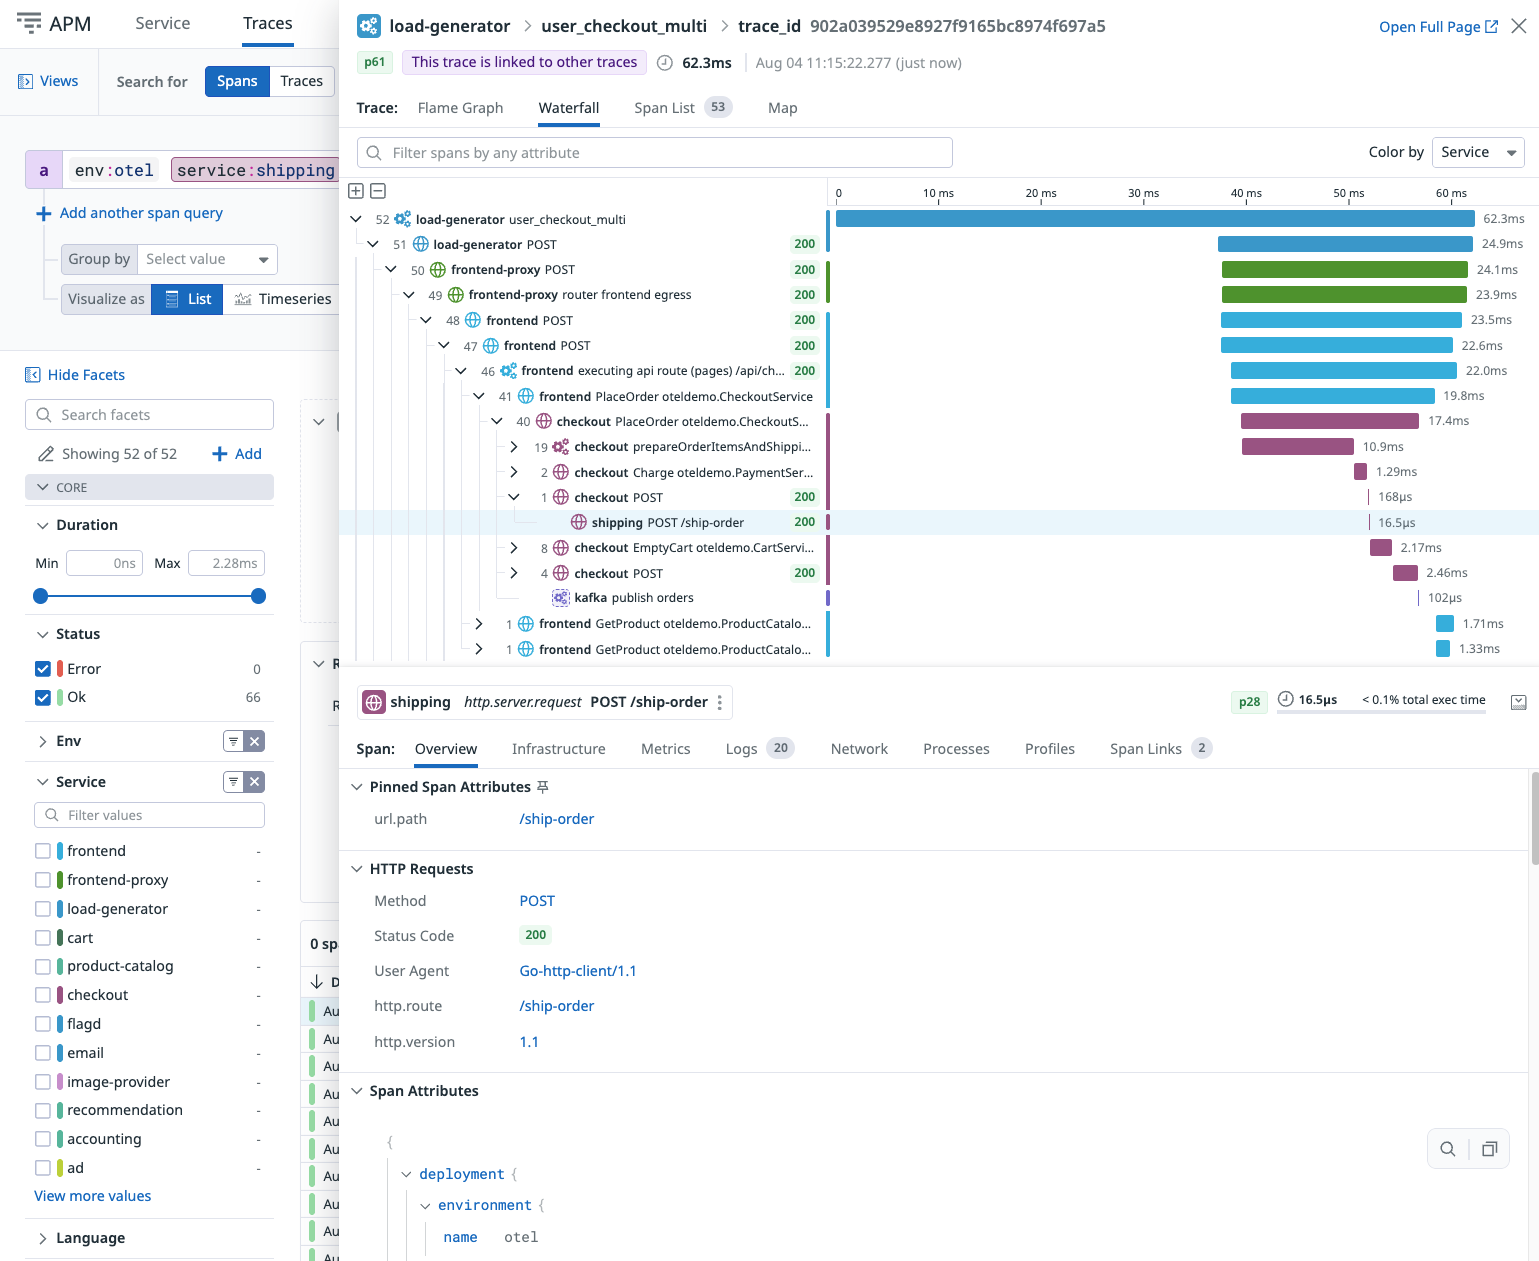
To send OpenTelemetry metrics and traces generated by Shield360 from your AI Application to DataDog via the DataDog Agent, follow the below steps.
1. DataDog Agent Setup
graph LR A[AI Application<br/>Instrumented by Shield360] --> B[DataDog Agent<br/>localhost:4318] B --> C[DataDog Backend<br/>APM & Logs]2. Instrument your application
For direct integration into your Python applications:
import shield360
shield360.init( otlp_endpoint="http://localhost:4318")import shield360
shield360.init()Set these environment variables:
export OTEL_EXPORTER_OTLP_ENDPOINT="http://localhost:4318"Refer to the Shield360 SDK configuration reference for more advanced configurations and use cases.
For zero-code auto-instrumentation via command line:
# Using CLI argumentsshield360-instrument \ --otlp-endpoint "http://localhost:4318" \ --service-name "my-ai-service" \ --deployment-environment "production" \ python app.py# Set environment variables (takes precedence over CLI args)export OTEL_EXPORTER_OTLP_ENDPOINT="http://localhost:4318"export OTEL_SERVICE_NAME="my-ai-service"export OTEL_DEPLOYMENT_ENVIRONMENT="production"
# Run your applicationshield360-instrument python app.pyRefer to the Shield360 SDK configuration reference for more advanced configurations and use cases.
3. Exploring Telemetry in DataDog
Once your AI application is sending telemetry data to DataDog, you can explore and analyze it using DataDog’s powerful observability features:
Software Catalog
View all your AI services and their connections:
- Go to APM → Software Catalog
- Select Map to see how services are connected
- Change Map layout to Cluster or Flow for different views
- Select Catalog view, then click a service for performance summary
Trace Explorer
Explore traces from your AI applications:
- Navigate to Performance → Setup Guidance → View Traces
- Select an indexed span to view full trace details
- View correlated data across tabs:
- Infrastructure metrics for services with Host Metrics
- Runtime metrics for implemented services
- Log entries correlated with traces
- Span links connected to traces