

OpenObserve
To send OpenTelemetry metrics and traces generated by Shield360 from your AI Application to OpenObserve, follow the below steps.
1. Get your Credentials
- Log into your OpenObserve instance
- Navigate to Ingestion:
- Click Ingestion in the side navigation
- Select Traces (OpenTelemetry) option
- Copy OTLP Configuration:
- Under the OTLP HTTP section, copy:
- Ingestion HTTP Endpoint
- Ingestion Authorization key (the part after
Basic)
- Example endpoint:
http://127.0.0.1:5080/api/default - Example auth:
Authorization=Basic%20<Ingestion Authorization key>
- Under the OTLP HTTP section, copy:
2. Instrument your application
For direct integration into your Python applications:
import shield360
shield360.init(  otlp_endpoint="YOUR_OPENOBSERVE_HTTP_ENDPOINT",  otlp_headers="YOUR_OPENOBSERVE_AUTH_HEADER")
Replace:
YOUR_OPENOBSERVE_HTTP_ENDPOINTwith the Ingestion HTTP Endpoint value you copied in Step 1.- Example:
http://127.0.0.1:5080/api/default
- Example:
YOUR_OPENOBSERVE_AUTH_HEADERwith the Ingestion Authorization key value you copied in Step 1.- Example:
Authorization=Basic%20<Ingestion Authorization key>
- Example:
import shield360
shield360.init()
Set these environment variables:
export OTEL_EXPORTER_OTLP_ENDPOINT="YOUR_OPENOBSERVE_HTTP_ENDPOINT"export OTEL_EXPORTER_OTLP_HEADERS="YOUR_OPENOBSERVE_AUTH_HEADER"Replace:
YOUR_OPENOBSERVE_HTTP_ENDPOINTwith the Ingestion HTTP Endpoint value you copied in Step 1.- Example:
http://127.0.0.1:5080/api/default
- Example:
YOUR_OPENOBSERVE_AUTH_HEADERwith the Ingestion Authorization key value you copied in Step 1.- Example:
Authorization=Basic%20<Ingestion Authorization key>
- Example:
Refer to the Shield360 SDK configuration reference for more advanced configurations and use cases.
For zero-code auto-instrumentation via command line:
# Using CLI argumentsshield360-instrument \ --otlp-endpoint "YOUR_OPENOBSERVE_HTTP_ENDPOINT" \ --otlp-headers "YOUR_OPENOBSERVE_AUTH_HEADER" \ --service-name "my-ai-service" \ --deployment-environment "production" \ python app.pyReplace:
YOUR_OPENOBSERVE_HTTP_ENDPOINTwith the Ingestion HTTP Endpoint value you copied in Step 1.- Example:
http://127.0.0.1:5080/api/default
- Example:
YOUR_OPENOBSERVE_AUTH_HEADERwith the Ingestion Authorization key value you copied in Step 1.- Example:
Authorization=Basic%20<Ingestion Authorization key>
- Example:
# Set environment variables (takes precedence over CLI args)export OTEL_EXPORTER_OTLP_ENDPOINT="YOUR_OPENOBSERVE_HTTP_ENDPOINT"export OTEL_EXPORTER_OTLP_HEADERS="YOUR_OPENOBSERVE_AUTH_HEADER"export OTEL_SERVICE_NAME="my-ai-service"export OTEL_DEPLOYMENT_ENVIRONMENT="production"
# Run your applicationshield360-instrument python app.py
Replace:
YOUR_OPENOBSERVE_HTTP_ENDPOINTwith the Ingestion HTTP Endpoint value you copied in Step 1.- Example:
http://127.0.0.1:5080/api/default
- Example:
YOUR_OPENOBSERVE_AUTH_HEADERwith the Ingestion Authorization key value you copied in Step 1.- Example:
Authorization=Basic%20<Ingestion Authorization key>
- Example:
Refer to the Shield360 SDK configuration reference for more advanced configurations and use cases.
3. Import the pre-built Dashboard
- Log into your OpenObserve Instance
- Navigate to Dashboards:
- Click Dashboards in the side navigation menu
- Click Import on the top right corner
- Import Dashboard:
- Copy the dashboard JSON provided in the accordion below
- Paste the dashboard JSON text directly under the Import Dashboard from JSON section
- Click Import
- Save the dashboard
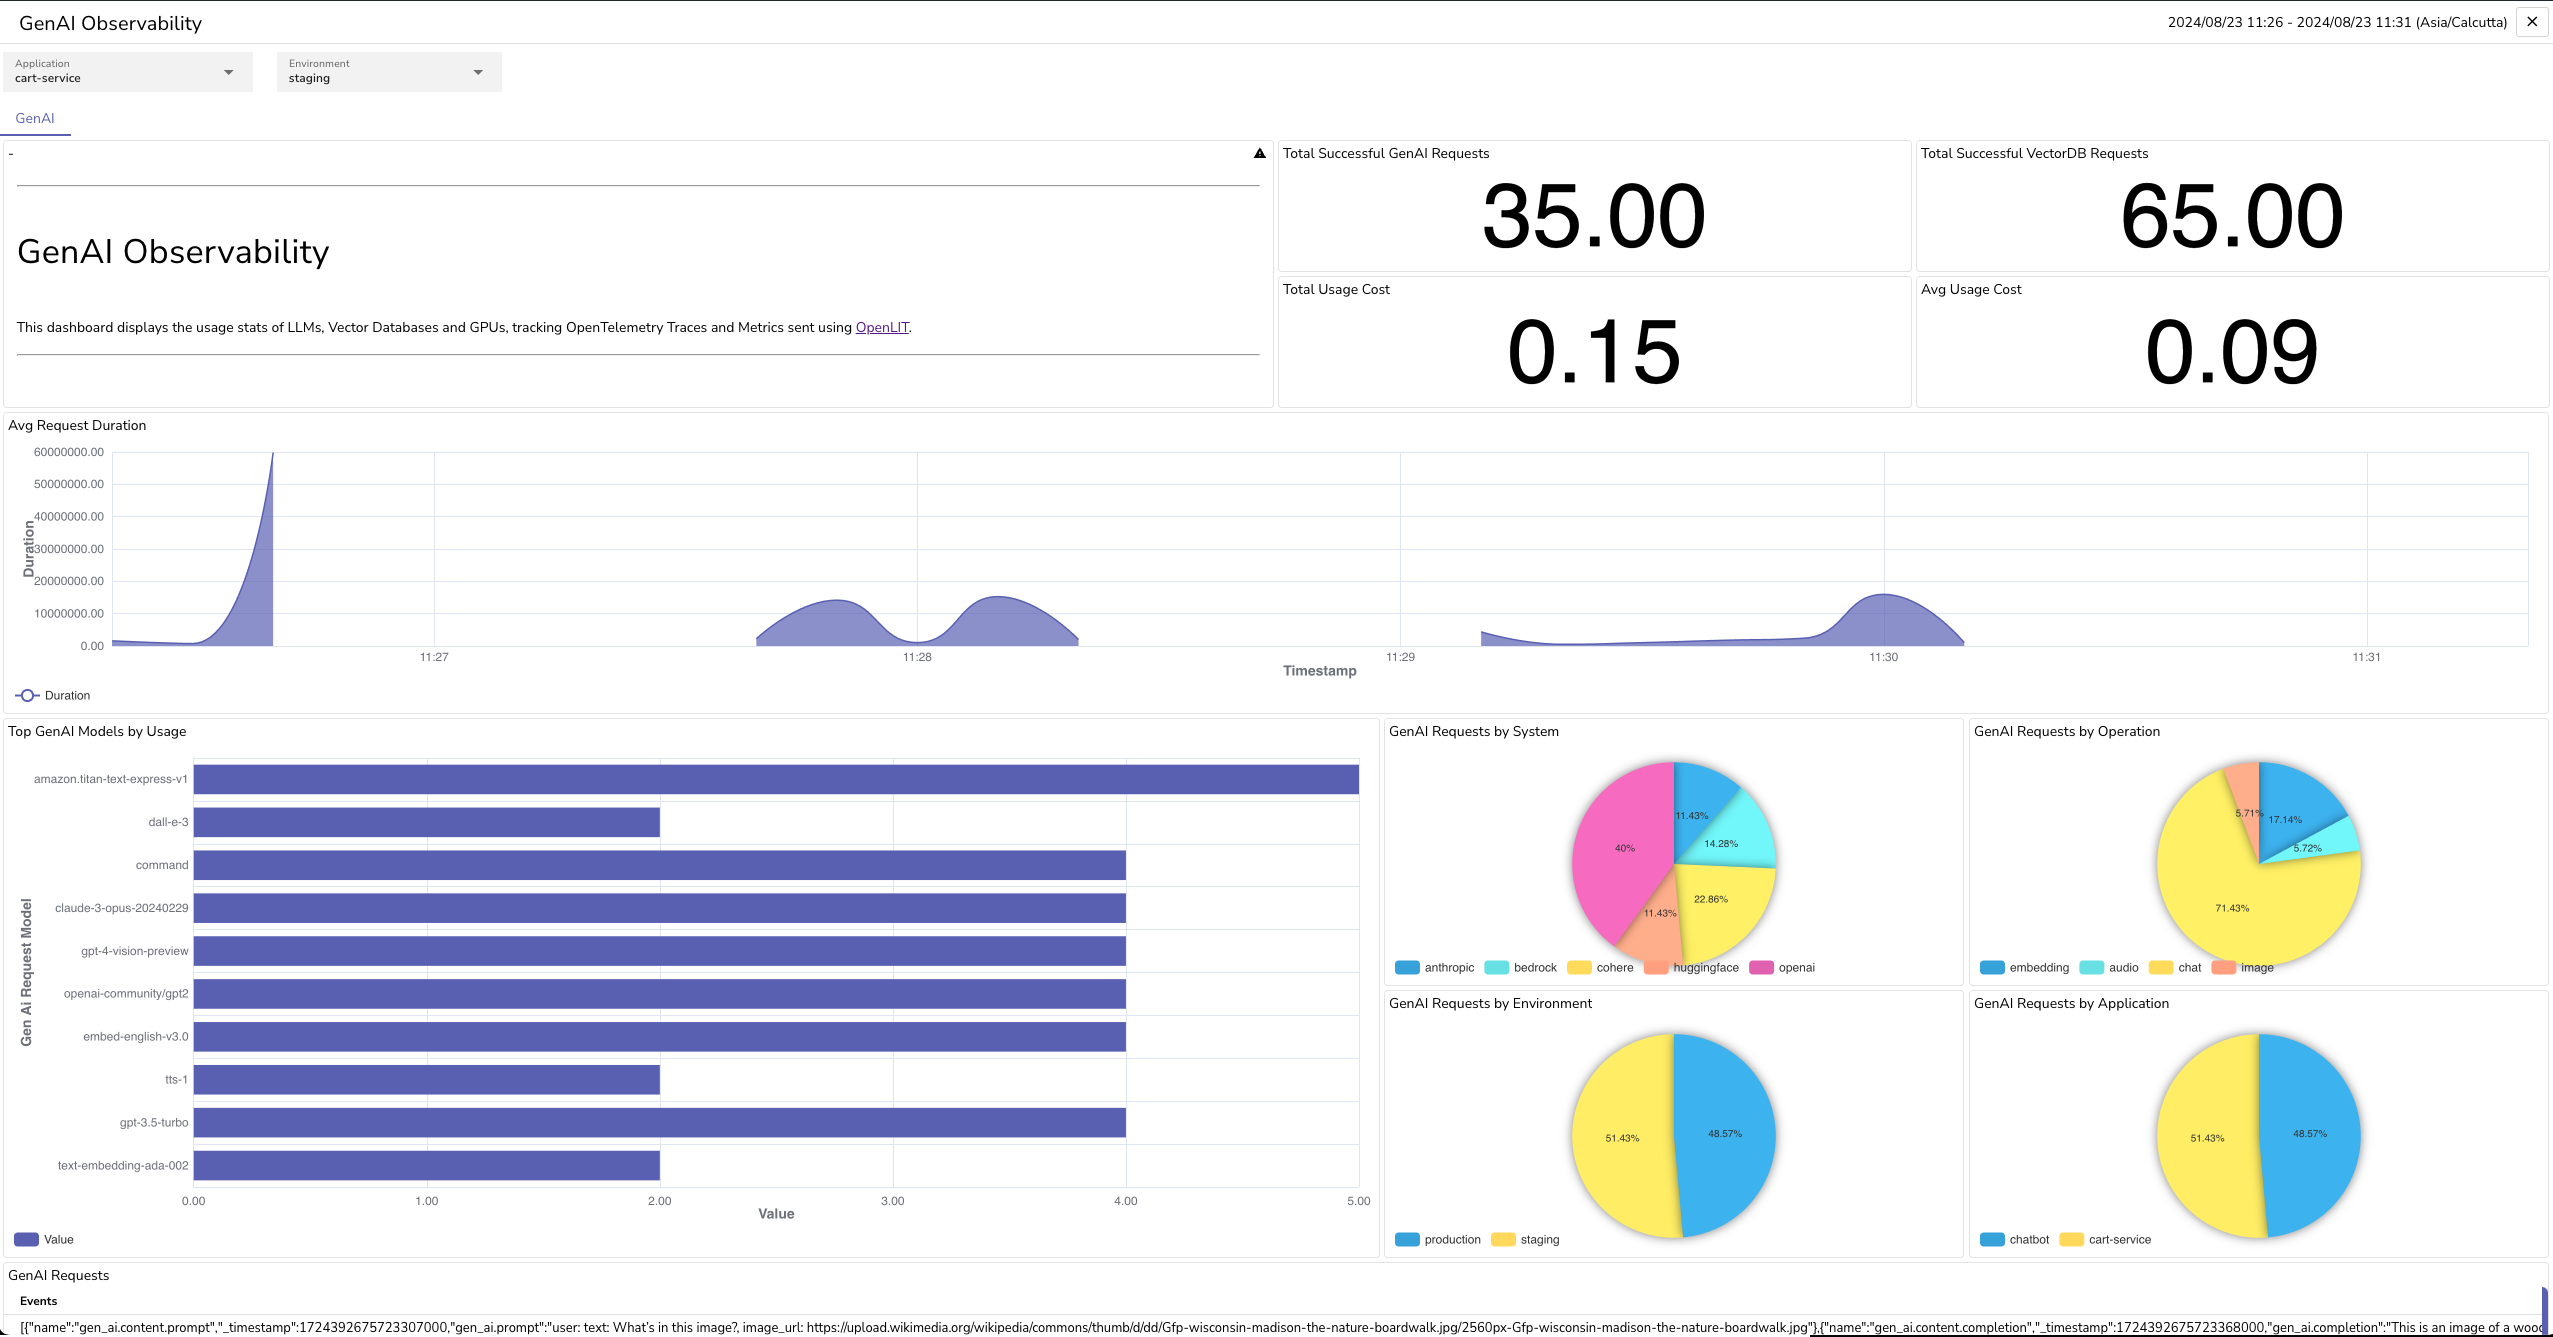
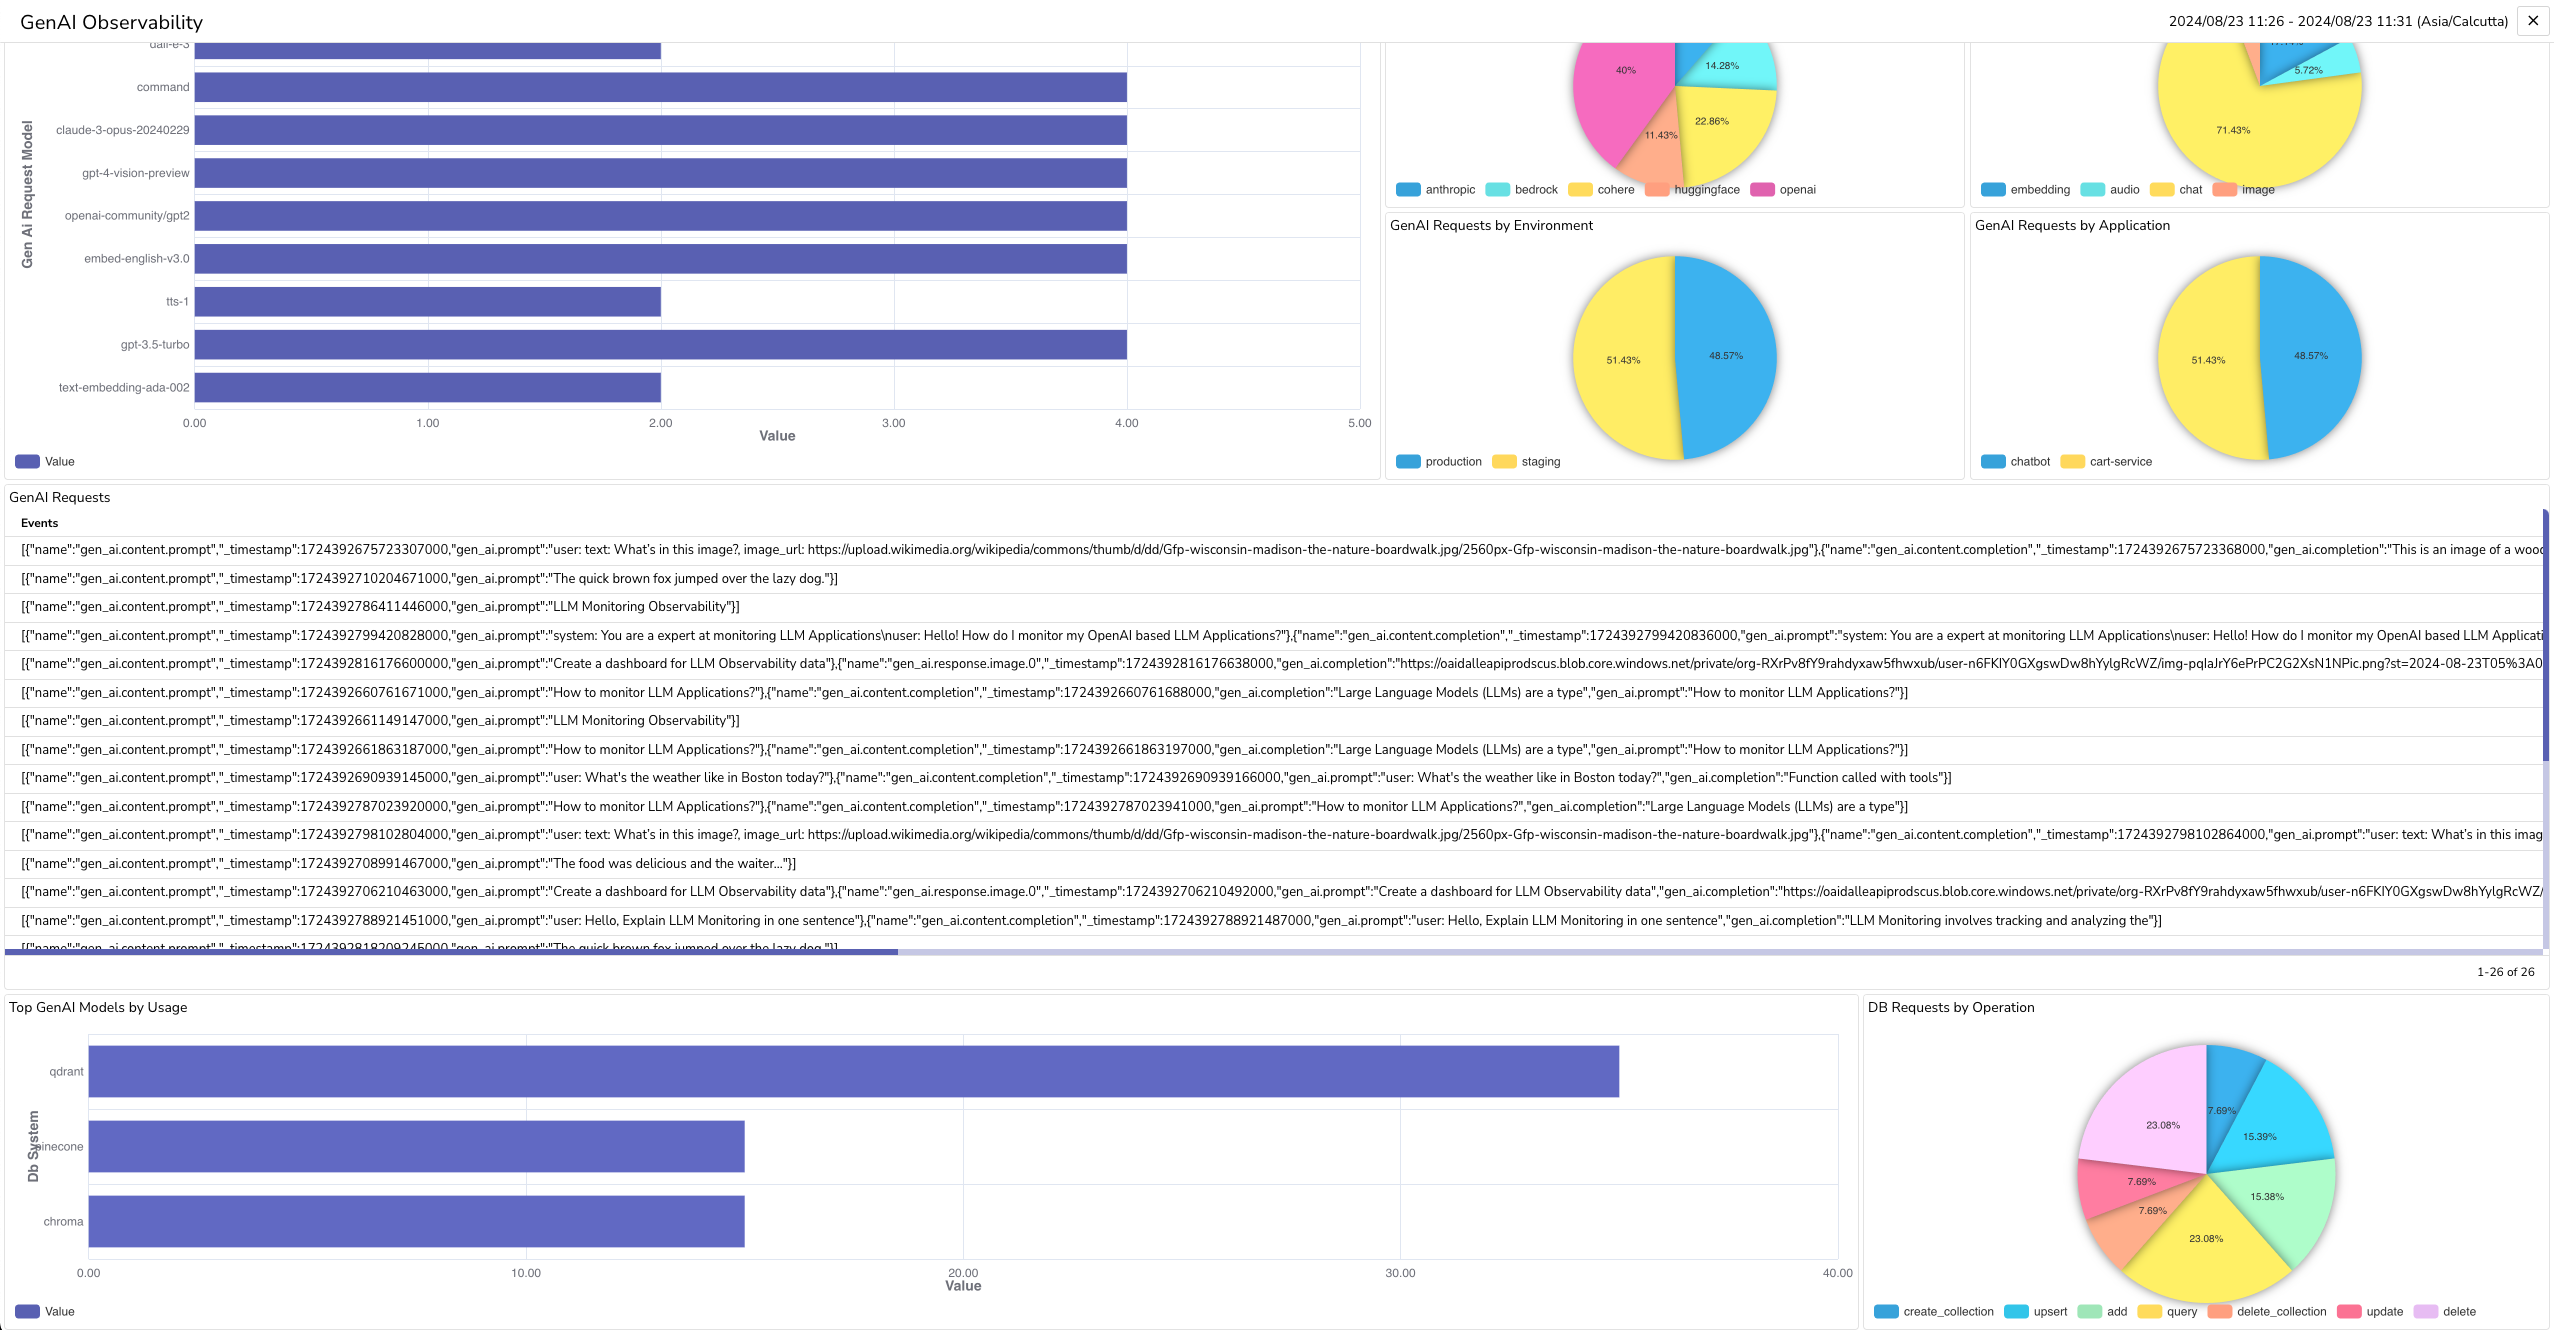
Dashboard
{ "version": 4, "dashboardId": "7232616793020301352", "title": "GenAI Observability", "description": "This dashboard tracks the performance of LLM and VectorDB, recording metrics like latency, tokens used, and cost. It also logs input and output data, including request IDs, timestamps, user IDs, and model versions. This helps identify how well the systems are working and where improvements can be made.", "role": "", "owner": "", "created": "2024-08-23T05:46:38.299Z", "tabs": [ { "tabId": "default", "name": "GenAI", "panels": [ { "id": "Panel_ID4678610", "type": "metric", "title": "Total Successful GenAI Requests", "description": "", "config": { "show_legends": true, "legend_position": "bottom", "unit": "short", "unit_custom": "", "decimals": 2 }, "queryType": "promql", "queries": [ { "query": "sum(gen_ai_total_requests{telemetry_sdk_name=\"shield360\"})", "customQuery": true, "fields": { "stream": "default", "stream_type": "metrics", "x": [], "y": [], "z": [], "filter": [] } } ], "layout": { "x": 0, "y": 0, "w": 8, "h": 6, "i": 0, "panelType": "metric" } }, { "id": "Panel_ID8765432", "type": "metric", "title": "Total VectorDB Requests", "description": "", "config": { "show_legends": true, "legend_position": "bottom", "unit": "short", "unit_custom": "", "decimals": 2 }, "queryType": "promql", "queries": [ { "query": "sum(db_total_requests{telemetry_sdk_name=\"shield360\"})", "customQuery": true, "fields": { "stream": "default", "stream_type": "metrics", "x": [], "y": [], "z": [], "filter": [] } } ], "layout": { "x": 8, "y": 0, "w": 8, "h": 6, "i": 1, "panelType": "metric" } } ] } ]}