

Data-source connectors
Data-source connectors attach Shield360 to observability backends for reading traces, logs, and metrics. Each connector is atomic: one Tempo instance, one Loki instance, one Prometheus endpoint.
Configure them from Configuration → Connectors (/connectors) or manage bindings from Organisation → Project → Connectors. Select the correct project and environment before adding or binding connectors.
Mental model
Section titled “Mental model”flowchart LR subgraph org [Organisation] proj[Project] end subgraph env [Environment] bindT[traces binding] bindL[logs binding] bindM[metrics binding] end proj --> env bindT --> C1[Connector A] bindL --> C2[Connector B] bindM --> C3[Connector C] C1 --> Tempo[Tempo] C2 --> Loki[Loki] C3 --> Prom[Prometheus]- Atomic connectors — never a multi-backend blob. One Tempo instance, one Loki instance, one Prometheus endpoint.
- Signal routing — each of traces / logs / metrics is bound independently. See Signal routing.
- Database Config — ClickHouse lives as a Database Config and appears as the built-in connector. See Database Config.
Supported connectors (Shield360 + OpenPlait)
Section titled “Supported connectors (Shield360 + OpenPlait)”These are the data-source connectors available in Shield360. OpenPlait packages power the portable query adapters for ClickHouse, Tempo, Loki, Prometheus, and Jaeger.
Built-in app store
Section titled “Built-in app store”| Connector | Package / implementation | Signals | What it’s for |
|---|---|---|---|
| ClickHouse | Database Config + @openplait/adapter-clickhouse | traces, logs, metrics (+ intelligence) | Default store; full correlation, raw SQL, evals metadata, vault |
External data-source connectors
Section titled “External data-source connectors”| Connector | Package / implementation | Signals | What it’s for |
|---|---|---|---|
| Grafana Tempo | @openplait/adapter-tempo | traces | TraceQL search, trace tree, span events |
| Grafana Loki | @openplait/adapter-loki | logs | LogQL logs; correlate by trace id / service |
| Prometheus | @openplait/adapter-prometheus | metrics | PromQL HTTP API (also works with Prometheus-compatible endpoints such as Mimir when you point at their query URL) |
| Jaeger | @openplait/adapter-jaeger | traces | Jaeger Query HTTP API; sampled in-process aggregates |
Capability matrix
Section titled “Capability matrix”| Connector | Signals | Trace tree | Span events | Server aggregation | Raw SQL | Cross-signal correlation |
|---|---|---|---|---|---|---|
| ClickHouse | traces, logs, metrics | Yes | Yes | Yes | Yes | Full |
| Tempo | traces | Yes | Yes | No* | No | trace / span / service |
| Loki | logs | — | — | No | No | trace id, service |
| Prometheus | metrics | — | — | Yes | No | — |
| Jaeger | traces | Yes | Yes | No* | No | trace / span / service |
* Aggregate graphs are reconstructed in-process from a bounded sample of full traces when the backend cannot aggregate server-side.
Add a Jaeger connector
Section titled “Add a Jaeger connector”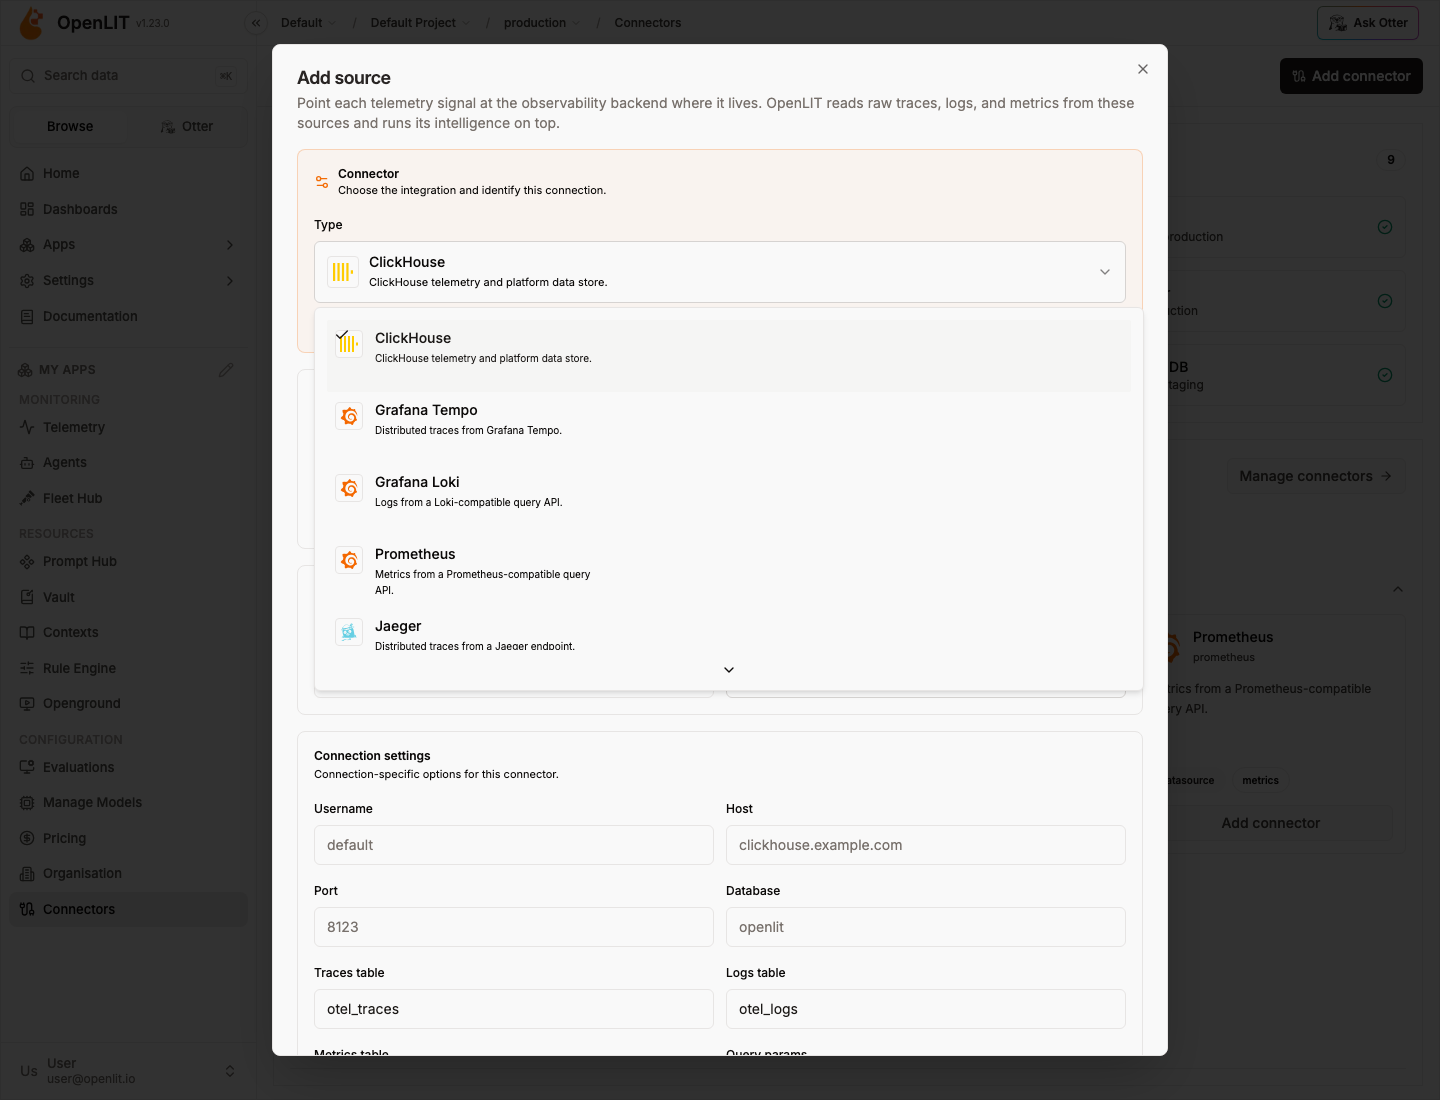
Use the header selectors to pick the project and environment.
Go to Configuration → Connectors and choose Add connector / Add source.
Select Jaeger from the data-source connector list.
Set the Query URL (local all-in-one: http://localhost:16686) and auth if needed.
Bind traces to the connector under signal routing.
Actions you can take on a connector
Section titled “Actions you can take on a connector”The connector registry is designed so actions attach to a connector type. Today’s data-source actions:
| Action | When to use it |
|---|---|
| Add / edit connector | Point Shield360 at a new endpoint or rotate settings |
| Store credentials in Vault | API keys and tokens stay encrypted; decrypted only server-side |
| Health check / test connection | Confirm the endpoint is reachable with current auth |
| Validate AI signal | Confirm recent AI telemetry exists (gen_ai.* / Shield360 markers) |
| Bind signal | Route traces, logs, or metrics to this connector for an environment |
| Unbind / rebind | Move a signal to another connector without deleting history in the backend |
| Mark Database Config active | Choose which ClickHouse app store the UI uses |
| Share Database Config | Grant edit / delete / re-share on a ClickHouse connection |
Enterprise audit logs record connector create/update/delete/test plus bind/unbind (with signal, environment, and previous source when switching).
How Shield360 finds AI telemetry
Section titled “How Shield360 finds AI telemetry”Backends hold all telemetry — not only AI. Shield360 applies a layered AI selector so reads stay focused:
- Resource
telemetry.sdk.name = shield360 - Resource
telemetry.distro.name = shield360-cli - Any
gen_ai.*attribute coding_agent.session.id, or Claude Code session markers- Known
coding_agent.*span names
Authentication cheat sheet
Section titled “Authentication cheat sheet”| Backend | Typical auth |
|---|---|
| Grafana Cloud (Tempo / Loki) | Basic: instance ID + access policy token (traces:read / logs:read). Use query URLs from the Cloud Portal. |
| Self-hosted Tempo / Loki / Prometheus / Jaeger | None, Basic, or Bearer; optional tenant / X-Scope-OrgID |
| ClickHouse | Username / password on the Database Config |
Security and reliability
Section titled “Security and reliability”- Endpoints validated (
http/httpsonly); credentials in URLs rejected; private/metadata SSRF targets blocked where applicable. - Secrets live in Vault, redacted from errors, never logged.
- Per-source concurrency caps, query budgets, short-lived cache + in-flight de-dupe, and backoff on transient
429/5xx.
OpenPlait packages
Section titled “OpenPlait packages”Shield360 wraps these npm packages for portable reads:
| npm package | Used for |
|---|---|
@openplait/core | Query IR and normalized results |
@openplait/adapter-sdk | Adapter contracts |
@openplait/adapter-clickhouse | ClickHouse / OTel |
@openplait/adapter-tempo | Tempo / TraceQL |
@openplait/adapter-loki | Loki / LogQL |
@openplait/adapter-prometheus | Prometheus / PromQL |
@openplait/adapter-jaeger | Jaeger Query HTTP API |
@openplait/runtime | Planning and execution helpers |
See the OpenPlait repository for publishing and adapter docs.